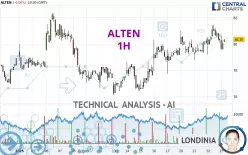
ALTEN - 1H - Technical analysis published on 01/23/2025 (GMT)
- 63
- 0
Click here for a new analysis!
- Timeframe : 1H
- - Analysis generated on
- Status : TARGET REACHED

Summary of the analysis

Additional analysis
Quotes
The ALTEN rating is 80.35 EUR. On the day, this instrument lost -0.06% and was between 79.60 EUR and 80.60 EUR. This implies that the price is at +0.94% from its lowest and at -0.31% from its highest.The Central Gaps scanner detects a bearish opening marking the presence of sellers ahead of buyers at the opening but not sufficiently marked to allow the price to register a quotation gap.
Bearish opening
Type : Bearish
Timeframe : Openning
A study of price movements over other periods shows the following variations:
Near a new LOW record (1st january)
Type : Bearish
Timeframe : Weekly
Near a new LOW record (1 month)
Type : Bearish
Timeframe : Weekly
Technical
A technical analysis in 1H of this ALTEN chart shows a strongly bullish trend. 92.86% of the signals given by moving averages are bullish. This strongly bullish trend is supported by the strong bullish signals given by short-term moving averages. An assessment of moving averages reveals several bullish signals that could impact this trend:
Bullish trend reversal : Moving Average 100
Type : Bullish
Timeframe : 1 hour
Bullish price crossover with Moving Average 20
Type : Bullish
Timeframe : 1 hour
An assessment of technical indicators does not currently provide any relevant information to suggest whether the signal given by the technical indicators is more bullish or bearish.
Central Indicators, the detector scanner for these technical indicators recently detected a signal:
RSI indicator is back over 50
Type : Bullish
Timeframe : 1 hour
Central Patterns, the market scanner focusing on chart patterns, resistances and supports found this result:
Near support of channel
Type : Bullish
Timeframe : 1 hour
The presence of a bearish pattern in Japanese candlesticks detected by Central Candlesticks that could cause a correction in the very short term was also detected:
Bearish doji star
Type : Bearish
Timeframe : 1 hour
| S3 | S2 | S1 | Price | R1 | R2 | R3 | |
|---|---|---|---|---|---|---|---|
| ProTrendLines | 76.97 | 79.19 | 80.33 | 80.35 | 81.00 | 82.15 | 90.93 |
| Change (%) | -4.21% | -1.44% | -0.02% | - | +0.81% | +2.24% | +13.17% |
| Change | -3.38 | -1.16 | -0.02 | - | +0.65 | +1.80 | +10.58 |
| Level | Intermediate | Intermediate | Minor | - | Minor | Major | Intermediate |
Attention could also be paid to pivot points to set price objectives:
| Pivot points | S3 | S2 | S1 | PP | R1 | R2 | R3 |
|---|---|---|---|---|---|---|---|
| Standard | 77.00 | 78.10 | 79.25 | 80.35 | 81.50 | 82.60 | 83.75 |
| Camarilla | 79.78 | 79.99 | 80.19 | 80.40 | 80.61 | 80.81 | 81.02 |
| Woodie | 77.03 | 78.11 | 79.28 | 80.36 | 81.53 | 82.61 | 83.78 |
| Fibonacci | 78.10 | 78.96 | 79.49 | 80.35 | 81.21 | 81.74 | 82.60 |
| Pivot points | S3 | S2 | S1 | PP | R1 | R2 | R3 |
|---|---|---|---|---|---|---|---|
| Standard | 72.83 | 74.47 | 77.08 | 78.72 | 81.33 | 82.97 | 85.58 |
| Camarilla | 78.53 | 78.92 | 79.31 | 79.70 | 80.09 | 80.48 | 80.87 |
| Woodie | 73.33 | 74.71 | 77.58 | 78.96 | 81.83 | 83.21 | 86.08 |
| Fibonacci | 74.47 | 76.09 | 77.09 | 78.72 | 80.34 | 81.34 | 82.97 |
| Pivot points | S3 | S2 | S1 | PP | R1 | R2 | R3 |
|---|---|---|---|---|---|---|---|
| Standard | 66.23 | 70.32 | 74.68 | 78.77 | 83.13 | 87.22 | 91.58 |
| Camarilla | 76.73 | 77.50 | 78.28 | 79.05 | 79.83 | 80.60 | 81.37 |
| Woodie | 66.38 | 70.39 | 74.83 | 78.84 | 83.28 | 87.29 | 91.73 |
| Fibonacci | 70.32 | 73.55 | 75.54 | 78.77 | 82.00 | 83.99 | 87.22 |
Numerical data
The following is the status of technical indicators and moving averages registered at the time this technical analysis was created:
| RSI (14): | 53.45 | |
| MACD (12,26,9): | 0.2000 | |
| Directional Movement: | -4.46 | |
| AROON (14): | 28.57 | |
| DEMA (21): | 80.47 | |
| Parabolic SAR (0,02-0,02-0,2): | 81.38 | |
| Elder Ray (13): | -0.02 | |
| Super Trend (3,10): | 79.56 | |
| Zig ZAG (10): | 80.30 | |
| VORTEX (21): | 1.0600 | |
| Stochastique (14,3,5): | 34.81 | |
| TEMA (21): | 80.38 | |
| Williams %R (14): | -51.11 | |
| Chande Momentum Oscillator (20): | 0.05 | |
| Repulse (5,40,3): | -0.0500 | |
| ROCnROLL: | 1 | |
| TRIX (15,9): | 0.0500 | |
| Courbe Coppock: | 1.47 |
| MA7: | 79.49 | |
| MA20: | 78.70 | |
| MA50: | 78.05 | |
| MA100: | 84.46 | |
| MAexp7: | 80.23 | |
| MAexp20: | 80.15 | |
| MAexp50: | 79.64 | |
| MAexp100: | 79.15 | |
| Price / MA7: | +1.08% | |
| Price / MA20: | +2.10% | |
| Price / MA50: | +2.95% | |
| Price / MA100: | -4.87% | |
| Price / MAexp7: | +0.15% | |
| Price / MAexp20: | +0.25% | |
| Price / MAexp50: | +0.89% | |
| Price / MAexp100: | +1.52% |
News
The last news published on ALTEN at the time of the generation of this analysis was as follows:
- ALTEN Selects Kneat to Digitize Validation
- ALTEN Acquires QA Consultants, Bringing Independent Software Quality Engineering Capabilities to its Services Portfolio
- Equiteq advises Alten on its first Korean acquisition, AP Solutions, a local leader in technology and engineering services
- Equiteq advises Alten on its first Korean acquisition, AP Solutions, a local leader in technology and engineering services
- ALTEN Calsoft Labs rebrands its business name as ACL Digital to represent and reemphasize its capabilities in the digital ecosystem
About author
Online


Add a comment
Comments
0 comments on the analysis ALTEN - 1H