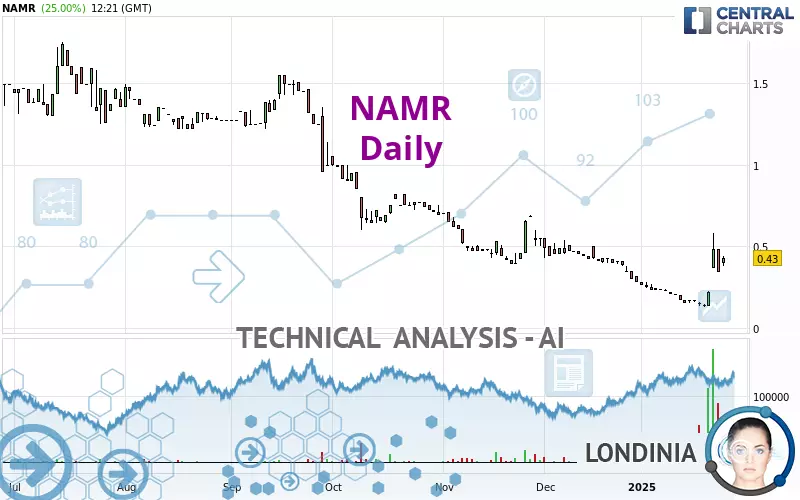
NAMR - Daily - Technical analysis published on 01/27/2025 (GMT)
- 73
- 0
Click here for a new analysis!
- Timeframe : Daily
- - Analysis generated on
- Status : INVALID

Summary of the analysis

Additional analysis
Quotes
The NAMR price is 0.430 EUR. On the day, this instrument gained +25.00% and was between 0.380 EUR and 0.440 EUR. This implies that the price is at +13.16% from its lowest and at -2.27% from its highest.The Central Gaps scanner detects a bullish opening marking the presence of buyers ahead of sellers at the opening but not sufficiently marked to allow the price to register a quotation gap.
Bullish opening
Type : Bullish
Timeframe : Openning
Here is a more detailed summary of the historical variations registered by NAMR:
Abnormal volumes
Timeframe : 5 days
Abnormal volumes
Timeframe : 20 days
Abnormal volumes
Timeframe : 50 days
Technical
Technical analysis of this Daily chart of NAMR indicates that the overall trend is slightly bearish. Only 57.14% of the signals given by moving averages are bearish. This slightly bearish trend could quickly be reversed due to the strong bullish signals currently being given by short-term moving averages. An assessment of moving averages reveals several bullish signals that could impact this trend:
Bullish price crossover with Moving Average 50
Type : Bullish
Timeframe : Daily
Bullish price crossover with adaptative moving average 100
Type : Bullish
Timeframe : Daily
The probability of a further increase are moderate given the direction of the technical indicators.
Caution: the Central Indicators scanner currently detects an excess:
CCI indicator is overbought : over 100
Type : Neutral
Timeframe : Daily
Williams %R indicator is back over -50
Type : Bullish
Timeframe : Daily
No signals are given by Central Patterns, a market scanner specialised in chart patterns, resistances and supports.
For a small rebound in the very short term, the Central Candlesticks scanner currently notes the presence of this bullish pattern in Japanese candlesticks:
Bullish harami
Type : Bullish
Timeframe : Daily
| Price | R1 | R2 | R3 | |
|---|---|---|---|---|
| ProTrendLines | 0.430 | 0.680 | 1.213 | 1.550 |
| Change (%) | - | +58.14% | +182.09% | +260.47% |
| Change | - | +0.250 | +0.783 | +1.120 |
| Level | - | Minor | Intermediate | Intermediate |
Attention could also be paid to pivot points to set price objectives:
| Pivot points | S3 | S2 | S1 | PP | R1 | R2 | R3 |
|---|---|---|---|---|---|---|---|
| Standard | 0.159 | 0.251 | 0.297 | 0.389 | 0.435 | 0.527 | 0.573 |
| Camarilla | 0.306 | 0.319 | 0.331 | 0.344 | 0.357 | 0.369 | 0.382 |
| Woodie | 0.137 | 0.240 | 0.275 | 0.378 | 0.413 | 0.516 | 0.551 |
| Fibonacci | 0.251 | 0.303 | 0.336 | 0.389 | 0.441 | 0.474 | 0.527 |
| Pivot points | S3 | S2 | S1 | PP | R1 | R2 | R3 |
|---|---|---|---|---|---|---|---|
| Standard | -0.331 | -0.101 | 0.121 | 0.351 | 0.573 | 0.803 | 1.025 |
| Camarilla | 0.220 | 0.261 | 0.303 | 0.344 | 0.385 | 0.427 | 0.468 |
| Woodie | -0.334 | -0.103 | 0.118 | 0.349 | 0.570 | 0.801 | 1.022 |
| Fibonacci | -0.101 | 0.071 | 0.178 | 0.351 | 0.523 | 0.630 | 0.803 |
| Pivot points | S3 | S2 | S1 | PP | R1 | R2 | R3 |
|---|---|---|---|---|---|---|---|
| Standard | -0.080 | 0.100 | 0.190 | 0.370 | 0.460 | 0.640 | 0.730 |
| Camarilla | 0.206 | 0.231 | 0.255 | 0.280 | 0.305 | 0.330 | 0.354 |
| Woodie | -0.125 | 0.078 | 0.145 | 0.348 | 0.415 | 0.618 | 0.685 |
| Fibonacci | 0.100 | 0.203 | 0.267 | 0.370 | 0.473 | 0.537 | 0.640 |
Numerical data
The following are the details of the technical indicators and moving averages that were collected to generate this technical analysis:
| RSI (14): | 59.72 | |
| MACD (12,26,9): | -0.0150 | |
| Directional Movement: | 26.410 | |
| AROON (14): | 14.285 | |
| DEMA (21): | 0.246 | |
| Parabolic SAR (0,02-0,02-0,2): | 0.152 | |
| Elder Ray (13): | 0.128 | |
| Super Trend (3,10): | 0.279 | |
| Zig ZAG (10): | 0.430 | |
| VORTEX (21): | 0.8270 | |
| Stochastique (14,3,5): | 64.16 | |
| TEMA (21): | 0.293 | |
| Williams %R (14): | -33.19 | |
| Chande Momentum Oscillator (20): | 0.201 | |
| Repulse (5,40,3): | -2.7690 | |
| ROCnROLL: | -1 | |
| TRIX (15,9): | -2.3100 | |
| Courbe Coppock: | 39.24 |
| MA7: | 0.275 | |
| MA20: | 0.243 | |
| MA50: | 0.373 | |
| MA100: | 0.653 | |
| MAexp7: | 0.315 | |
| MAexp20: | 0.285 | |
| MAexp50: | 0.393 | |
| MAexp100: | 0.600 | |
| Price / MA7: | +56.36% | |
| Price / MA20: | +76.95% | |
| Price / MA50: | +15.28% | |
| Price / MA100: | -34.15% | |
| Price / MAexp7: | +36.51% | |
| Price / MAexp20: | +50.88% | |
| Price / MAexp50: | +9.41% | |
| Price / MAexp100: | -28.33% |
About author
Online


Add a comment
Comments
0 comments on the analysis NAMR - Daily