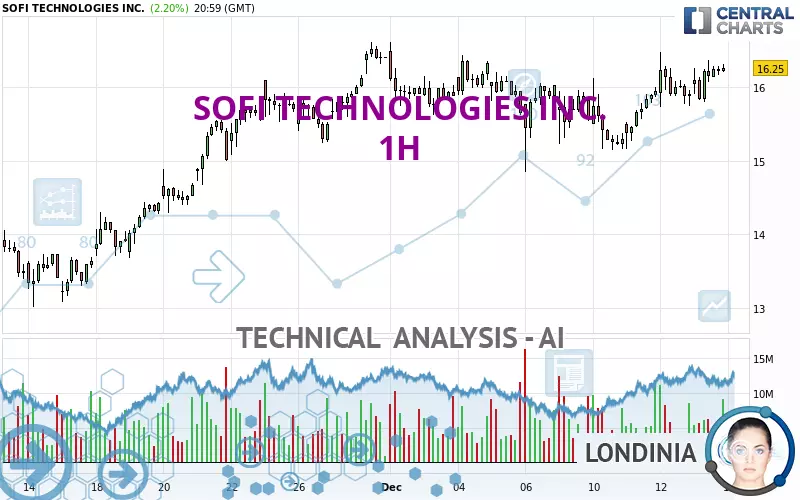
SOFI TECHNOLOGIES INC. - 1H - Technical analysis published on 12/14/2024 (GMT)
- 92
- 0
Click here for a new analysis!
- Timeframe : 1H
- - Analysis generated on
- Status : TARGET REACHED
Summary of the analysis

Additional analysis
Quotes
The SOFI TECHNOLOGIES INC. price is 16.25 USD. The price registered an increase of +2.20% on the session and was traded between 15.79 USD and 16.36 USD over the period. The price is currently at +2.91% from its lowest and -0.67% from its highest.A bullish opening was detected by the Central Gaps scanner. Buyers are trying to impose a bullish momentum in the very short term.
Bullish opening
Type : Bullish
Timeframe : Openning
A study of price movements over other periods shows the following variations:
Near a new HIGH record (1 year)
Type : Bullish
Timeframe : Weekly
Near a new HIGH record (1st january)
Type : Bullish
Timeframe : Weekly
Near a new HIGH record (1 month)
Type : Bullish
Timeframe : Weekly
Technical
A technical analysis in 1H of this SOFI TECHNOLOGIES INC. chart shows a strongly bullish trend. The signals given by the moving averages are 89.29% bullish. This strong bullish trend is confirmed by the strong signals currently being given by short-term moving averages. The Central Indicators scanner does not detect any result on moving averages that would impact this trend.
In fact, 14 technical indicators on 18 studied are currently bullish. Caution: the Central Indicators scanner currently detects an excess:
CCI indicator is overbought : over 100
Type : Neutral
Timeframe : 1 hour
Price is back over the pivot point
Type : Bullish
Timeframe : Weekly
Momentum indicator is back over 0
Type : Bullish
Timeframe : 1 hour
Central Patterns, the scanner specializing in chart patterns, did not identify any signals.
The Central Candlesticks scanner which studies Japanese candlesticks did not detect anything.
| S3 | S2 | S1 | Price | R1 | R2 | R3 | |
|---|---|---|---|---|---|---|---|
| ProTrendLines | 12.20 | 13.40 | 14.61 | 16.25 | 16.41 | 17.46 | 23.89 |
| Change (%) | -24.92% | -17.54% | -10.09% | - | +0.98% | +7.45% | +47.02% |
| Change | -4.05 | -2.85 | -1.64 | - | +0.16 | +1.21 | +7.64 |
| Level | Minor | Intermediate | Intermediate | - | Major | Minor | Major |
Attention could also be paid to pivot points to set price objectives:
| Pivot points | S3 | S2 | S1 | PP | R1 | R2 | R3 |
|---|---|---|---|---|---|---|---|
| Standard | 15.34 | 15.56 | 15.91 | 16.13 | 16.48 | 16.70 | 17.05 |
| Camarilla | 16.09 | 16.15 | 16.20 | 16.25 | 16.30 | 16.36 | 16.41 |
| Woodie | 15.40 | 15.59 | 15.97 | 16.16 | 16.54 | 16.73 | 17.11 |
| Fibonacci | 15.56 | 15.78 | 15.92 | 16.13 | 16.35 | 16.49 | 16.70 |
| Pivot points | S3 | S2 | S1 | PP | R1 | R2 | R3 |
|---|---|---|---|---|---|---|---|
| Standard | 14.09 | 14.62 | 15.43 | 15.96 | 16.77 | 17.30 | 18.11 |
| Camarilla | 15.88 | 16.00 | 16.13 | 16.25 | 16.37 | 16.50 | 16.62 |
| Woodie | 14.24 | 14.69 | 15.58 | 16.03 | 16.92 | 17.37 | 18.26 |
| Fibonacci | 14.62 | 15.13 | 15.45 | 15.96 | 16.47 | 16.79 | 17.30 |
| Pivot points | S3 | S2 | S1 | PP | R1 | R2 | R3 |
|---|---|---|---|---|---|---|---|
| Standard | 6.51 | 8.57 | 12.49 | 14.55 | 18.47 | 20.53 | 24.45 |
| Camarilla | 14.77 | 15.31 | 15.86 | 16.41 | 16.96 | 17.51 | 18.06 |
| Woodie | 7.44 | 9.04 | 13.42 | 15.02 | 19.40 | 21.00 | 25.38 |
| Fibonacci | 8.57 | 10.85 | 12.27 | 14.55 | 16.83 | 18.25 | 20.53 |
Numerical data
The following is the status of the technical indicators and moving averages at the time of publication of this technical analysis:
| RSI (14): | 59.41 | |
| MACD (12,26,9): | 0.1300 | |
| Directional Movement: | 10.46 | |
| AROON (14): | 0 | |
| DEMA (21): | 16.14 | |
| Parabolic SAR (0,02-0,02-0,2): | 15.70 | |
| Elder Ray (13): | 0.19 | |
| Super Trend (3,10): | 15.50 | |
| Zig ZAG (10): | 16.25 | |
| VORTEX (21): | 1.1900 | |
| Stochastique (14,3,5): | 67.56 | |
| TEMA (21): | 16.25 | |
| Williams %R (14): | -30.67 | |
| Chande Momentum Oscillator (20): | 0.12 | |
| Repulse (5,40,3): | 0.4400 | |
| ROCnROLL: | 1 | |
| TRIX (15,9): | 0.0900 | |
| Courbe Coppock: | 4.17 |
| MA7: | 15.80 | |
| MA20: | 15.49 | |
| MA50: | 12.67 | |
| MA100: | 10.03 | |
| MAexp7: | 16.16 | |
| MAexp20: | 15.99 | |
| MAexp50: | 15.86 | |
| MAexp100: | 15.54 | |
| Price / MA7: | +2.85% | |
| Price / MA20: | +4.91% | |
| Price / MA50: | +28.26% | |
| Price / MA100: | +62.01% | |
| Price / MAexp7: | +0.56% | |
| Price / MAexp20: | +1.63% | |
| Price / MAexp50: | +2.46% | |
| Price / MAexp100: | +4.57% |
News
The last news published on SOFI TECHNOLOGIES INC. at the time of the generation of this analysis was as follows:
- SoFi to Participate in Upcoming Investor Conferences
- SoFi Completes Acquisition of Technisys
- SoFi Schedules Conference Call to Discuss Q4 2021 & Full Year 2021 Results
About author

Online


Add a comment
Comments
0 comments on the analysis SOFI TECHNOLOGIES INC. - 1H