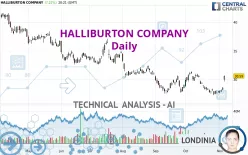
HALLIBURTON COMPANY - Daily - Technical analysis published on 11/06/2024 (GMT)
- 211
- 0
Click here for a new analysis!
- Timeframe : Daily
- - Analysis generated on
- Status : LEVEL MAINTAINED

Summary of the analysis

Additional analysis
Quotes
The HALLIBURTON COMPANY price is 30.59 USD. The price has increased by +7.22% since the last closing and was between 29.66 USD and 30.69 USD. This implies that the price is at +3.14% from its lowest and at -0.33% from its highest.The Central Gaps scanner detects the formation of a bullish gap marking the strong presence of buyers against sellers at the opening. This formed a quotation gap.
Opening Gap UP
Type : Bullish
Timeframe : Openning
A study of price movements over other periods shows the following variations:
Near a new HIGH record (1 month)
Type : Bullish
Timeframe : Weekly
Technical
Technical analysis of HALLIBURTON COMPANY in Daily shows an overall slightly bearish trend. Only 57.14% of the signals given by moving averages are bearish. This slightly bearish trend could quickly be reversed due to the strong bullish signals currently being given by short-term moving averages. An assessment of moving averages reveals several bullish signals that could impact this trend:
Bullish trend reversal : adaptative moving average 20
Type : Bullish
Timeframe : Daily
Bullish price crossover with Moving Average 20
Type : Bullish
Timeframe : Daily
Bullish price crossover with Moving Average 50
Type : Bullish
Timeframe : Daily
Bullish price crossover with adaptative moving average 20
Type : Bullish
Timeframe : Daily
Bullish price crossover with adaptative moving average 50
Type : Bullish
Timeframe : Daily
Bullish price crossover with adaptative moving average 100
Type : Bullish
Timeframe : Daily
An assessment of technical indicators shows a moderate bullish signal.
But beware of excesses. The Central Indicators scanner currently detects this:
CCI indicator is overbought : over 100
Type : Neutral
Timeframe : Daily
Williams %R indicator is overbought : over -20
Type : Neutral
Timeframe : Daily
Pivot points : price is over resistance 3
Type : Neutral
Timeframe : Daily
Pivot points : price is over resistance 3
Type : Neutral
Timeframe : Weekly
RSI indicator is back over 50
Type : Bullish
Timeframe : Daily
Aroon indicator bullish trend
Type : Bullish
Timeframe : Daily
SuperTrend indicator bullish reversal
Type : Bullish
Timeframe : Daily
The analysis of the price chart with Central Patterns scanners does not return any result.
The presence of a bullish Japanese candlestick pattern detected by Central Candlesticks that could cause a very short term rebound was also detected:
Upside gap
Type : Bullish
Timeframe : Daily
| S3 | S2 | S1 | Price | R1 | R2 | R3 | |
|---|---|---|---|---|---|---|---|
| ProTrendLines | 20.23 | 24.18 | 27.22 | 30.59 | 31.03 | 32.71 | 33.93 |
| Change (%) | -33.87% | -20.95% | -11.02% | - | +1.44% | +6.93% | +10.92% |
| Change | -10.36 | -6.41 | -3.37 | - | +0.44 | +2.12 | +3.34 |
| Level | Minor | Major | Major | - | Minor | Minor | Intermediate |
To determine price objectives, it is also possible to use the pivot points. Here is the price position in relation to pivot points:
| Pivot points | S3 | S2 | S1 | PP | R1 | R2 | R3 |
|---|---|---|---|---|---|---|---|
| Standard | 27.64 | 27.88 | 28.20 | 28.44 | 28.76 | 29.00 | 29.32 |
| Camarilla | 28.38 | 28.43 | 28.48 | 28.53 | 28.58 | 28.63 | 28.68 |
| Woodie | 27.69 | 27.90 | 28.25 | 28.46 | 28.81 | 29.02 | 29.37 |
| Fibonacci | 27.88 | 28.09 | 28.22 | 28.44 | 28.65 | 28.78 | 29.00 |
| Pivot points | S3 | S2 | S1 | PP | R1 | R2 | R3 |
|---|---|---|---|---|---|---|---|
| Standard | 26.37 | 26.81 | 27.25 | 27.69 | 28.13 | 28.57 | 29.01 |
| Camarilla | 27.44 | 27.52 | 27.60 | 27.68 | 27.76 | 27.84 | 27.92 |
| Woodie | 26.36 | 26.81 | 27.24 | 27.69 | 28.12 | 28.57 | 29.00 |
| Fibonacci | 26.81 | 27.15 | 27.36 | 27.69 | 28.03 | 28.24 | 28.57 |
| Pivot points | S3 | S2 | S1 | PP | R1 | R2 | R3 |
|---|---|---|---|---|---|---|---|
| Standard | 22.03 | 24.65 | 26.19 | 28.81 | 30.35 | 32.97 | 34.51 |
| Camarilla | 26.60 | 26.98 | 27.36 | 27.74 | 28.12 | 28.50 | 28.88 |
| Woodie | 21.50 | 24.38 | 25.66 | 28.54 | 29.82 | 32.70 | 33.98 |
| Fibonacci | 24.65 | 26.24 | 27.22 | 28.81 | 30.40 | 31.38 | 32.97 |
Numerical data
The following are the details of the technical indicators and moving averages that were collected to generate this technical analysis:
| RSI (14): | 64.44 | |
| MACD (12,26,9): | -0.2500 | |
| Directional Movement: | 11.32 | |
| AROON (14): | 50.00 | |
| DEMA (21): | 28.29 | |
| Parabolic SAR (0,02-0,02-0,2): | 27.29 | |
| Elder Ray (13): | 1.58 | |
| Super Trend (3,10): | 27.81 | |
| Zig ZAG (10): | 30.61 | |
| VORTEX (21): | 0.8900 | |
| Stochastique (14,3,5): | 70.27 | |
| TEMA (21): | 28.40 | |
| Williams %R (14): | -1.30 | |
| Chande Momentum Oscillator (20): | 2.36 | |
| Repulse (5,40,3): | 3.8600 | |
| ROCnROLL: | 1 | |
| TRIX (15,9): | -0.2100 | |
| Courbe Coppock: | 6.42 |
| MA7: | 28.27 | |
| MA20: | 28.70 | |
| MA50: | 29.16 | |
| MA100: | 30.99 | |
| MAexp7: | 28.71 | |
| MAexp20: | 28.69 | |
| MAexp50: | 29.46 | |
| MAexp100: | 30.84 | |
| Price / MA7: | +8.21% | |
| Price / MA20: | +6.59% | |
| Price / MA50: | +4.90% | |
| Price / MA100: | -1.29% | |
| Price / MAexp7: | +6.55% | |
| Price / MAexp20: | +6.62% | |
| Price / MAexp50: | +3.84% | |
| Price / MAexp100: | -0.81% |
News
The last news published on HALLIBURTON COMPANY at the time of the generation of this analysis was as follows:
- Thinking about buying stock in ATIF Holdings, SoundHound AI, Halliburton, Moderna, or Co-Diagnostics?
- CORE LABORATORIES AND HALLIBURTON ANNOUNCE COLLABORATION TO INTEGRATE DIGITAL ROCK CAPABILITIES WITH LABORATORY MEASURED DATA
- Halliburton Announces Dividend
- Halliburton Announces Second Quarter 2023 Results
- Halliburton Labs Welcomes Rocsole to its Clean Energy Accelerator Program
About author

Online


Add a comment
Comments
0 comments on the analysis HALLIBURTON COMPANY - Daily