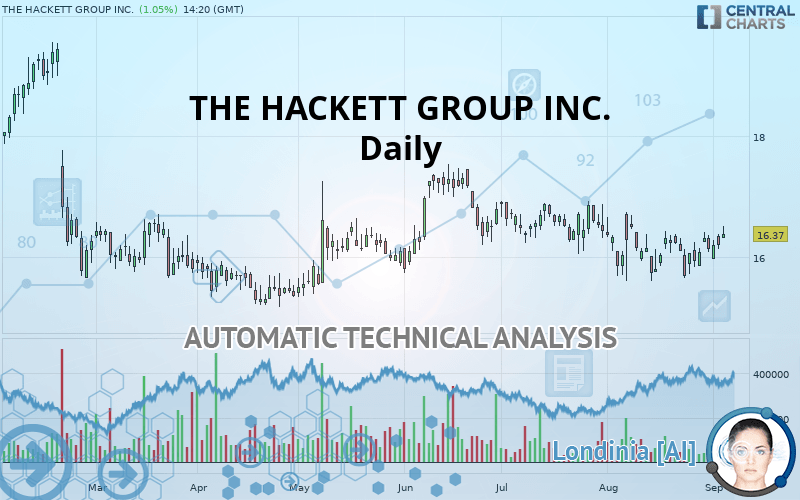
THE HACKETT GROUP INC. - Daily - Technical analysis published on 09/05/2019 (GMT)
- 322
- 0
- Who voted?
Oops, I was wrong about that analysis. My threshold for invalidation has been broken.
Click here for a new analysis!
Click here for a new analysis!
- Timeframe : Daily
- - Analysis generated on
- Status : INVALID

Summary of the analysis
Trends
Court terme:
Strongly bullish
De fond:
Slightly bullish
Technical indicators
56%
6%
39%
My opinion
Bullish above 16.32 USD
My targets
16.72 USD (+2.14%)
17.30 USD (+5.68%)
My analysis
THE HACKETT GROUP INC. is currently trying to strengthen its basic trend with a very bullish short term. As long as the price remains above 16.32 USD, traders may consider taking advantage of this bullish acceleration and setting themselves to trade only long positions (at the time of purchase). Buyers will encounter the resistance at 16.72 USD. A bullish break in this resistance would confirm a continuation of the bullish acceleration. The next resistance located at 17.30 USD would then be the next bullish objective for buyers. Crossing it would then enable buyers to target 18.39 USD. Beware of a possible return to under the support located at 16.32 USD which would be the sign of a correction of the bullish excesses registered in the short term.
Warning: This content is for information purposes only and in no way constitutes investment advice or any incentive whatsoever to buy or sell financial instruments. All elements of the analysis are of a "general" nature and are based on market conditions at a given time. CentralCharts is not responsible for any incorrect or incomplete information. Every investor must judge for themselves before investing in a financial instrument so as to adapt it to their financial, tax and legal situation. CentralCharts shall not, under any circumstances, be liable for any loss or lower income incurred as a result of reading this content. Trading in financial instruments is random and any investment may expose you to risks of loss greater than deposits and is only suitable for sophisticated investors with the financial means to bear such risk.

This analysis was given by Vincent Launay. Take part yourself by sharing additional analysis on another time unit:
Additional analysis
Quotes
The THE HACKETT GROUP INC. price is 16.37 USD. On the day, this instrument gained +1.05% and was traded between 16.30 USD and 16.50 USD over the period. The price is currently at +0.43% from its lowest and -0.79% from its highest.16.30
16.50
16.37
So that you have an overall view of the price change, here is a table showing the variations over several periods:
Technical
Technical analysis of this Daily chart of THE HACKETT GROUP INC. indicates that the overall trend is slightly bullish. 60.71% of the signals given by moving averages are bullish. The overall trend could accelerate as strong bullish signals from short-term moving averages are expected. There is no crossing of moving average by the price or crossing of moving averages between themselves.
The technical indicators are bullish. There is still some doubt about the price increase.
But beware of excesses. The Central Indicators scanner currently detects this:
Williams %R indicator is overbought : over -20
Type : Neutral
Timeframe : Daily
Price is back over the pivot point
Type : Bullish
Timeframe : Weekly
Price is back under the pivot point
Type : Bearish
Timeframe : Daily
The Central Patterns scanner, which studies chart patterns, resistances and supports, has identified these signals:
Horizontal resistance is broken
Type : Bullish
Timeframe : Daily
Resistance of channel is broken
Type : Bullish
Timeframe : Daily
Resistance of triangle is broken
Type : Bullish
Timeframe : Daily
The Central Candlesticks scanner, specialised in Japanese candlesticks, did not identify any signals.
ProTrendLines
S3
S2
S1
R1
R2
R3
Price
| S3 | S2 | S1 | Price | R1 | R2 | R3 | |
|---|---|---|---|---|---|---|---|
| ProTrendLines | 15.27 | 15.69 | 16.32 | 16.37 | 16.72 | 17.30 | 18.39 |
| Change (%) | -6.72% | -4.15% | -0.31% | - | +2.14% | +5.68% | +12.34% |
| Change | -1.10 | -0.68 | -0.05 | - | +0.35 | +0.93 | +2.02 |
| Level | Major | Major | Major | - | Major | Intermediate | Intermediate |
Pivot points can also be used to set your price objectives. Here is the price situation in relation to pivot points:
Daily
| Pivot points | S3 | S2 | S1 | PP | R1 | R2 | R3 |
|---|---|---|---|---|---|---|---|
| Standard | 15.68 | 15.82 | 16.01 | 16.15 | 16.33 | 16.47 | 16.66 |
| Camarilla | 16.10 | 16.13 | 16.16 | 16.19 | 16.22 | 16.25 | 16.28 |
| Woodie | 15.70 | 15.83 | 16.03 | 16.16 | 16.35 | 16.48 | 16.68 |
| Fibonacci | 15.82 | 15.94 | 16.02 | 16.15 | 16.27 | 16.35 | 16.47 |
Weekly
| Pivot points | S3 | S2 | S1 | PP | R1 | R2 | R3 |
|---|---|---|---|---|---|---|---|
| Standard | 15.07 | 15.39 | 15.76 | 16.08 | 16.45 | 16.77 | 17.14 |
| Camarilla | 15.94 | 16.00 | 16.07 | 16.13 | 16.19 | 16.26 | 16.32 |
| Woodie | 15.10 | 15.40 | 15.79 | 16.09 | 16.48 | 16.78 | 17.17 |
| Fibonacci | 15.39 | 15.65 | 15.82 | 16.08 | 16.34 | 16.51 | 16.77 |
Monthly
| Pivot points | S3 | S2 | S1 | PP | R1 | R2 | R3 |
|---|---|---|---|---|---|---|---|
| Standard | 14.42 | 15.00 | 15.57 | 16.15 | 16.72 | 17.30 | 17.87 |
| Camarilla | 15.81 | 15.92 | 16.03 | 16.13 | 16.24 | 16.34 | 16.45 |
| Woodie | 14.41 | 15.00 | 15.56 | 16.15 | 16.71 | 17.30 | 17.86 |
| Fibonacci | 15.00 | 15.44 | 15.71 | 16.15 | 16.59 | 16.86 | 17.30 |
Numerical data
The following is the status of the technical indicators and moving averages at the time of publication of this technical analysis:
Technical indicators
Moving averages
| RSI (14): | 53.54 | |
| MACD (12,26,9): | -0.0300 | |
| Directional Movement: | -0.03 | |
| AROON (14): | 57.14 | |
| DEMA (21): | 16.10 | |
| Parabolic SAR (0,02-0,02-0,2): | 15.71 | |
| Elder Ray (13): | 0.24 | |
| Super Trend (3,10): | 16.99 | |
| Zig ZAG (10): | 16.20 | |
| VORTEX (21): | 0.9900 | |
| Stochastique (14,3,5): | 70.24 | |
| TEMA (21): | 16.09 | |
| Williams %R (14): | -27.45 | |
| Chande Momentum Oscillator (20): | 0.19 | |
| Repulse (5,40,3): | -0.4400 | |
| ROCnROLL: | -1 | |
| TRIX (15,9): | -0.0900 | |
| Courbe Coppock: | 0.57 |
| MA7: | 16.13 | |
| MA20: | 16.11 | |
| MA50: | 16.36 | |
| MA100: | 16.27 | |
| MAexp7: | 16.14 | |
| MAexp20: | 16.17 | |
| MAexp50: | 16.28 | |
| MAexp100: | 16.42 | |
| Price / MA7: | +1.49% | |
| Price / MA20: | +1.61% | |
| Price / MA50: | +0.06% | |
| Price / MA100: | +0.61% | |
| Price / MAexp7: | +1.43% | |
| Price / MAexp20: | +1.24% | |
| Price / MAexp50: | +0.55% | |
| Price / MAexp100: | -0.30% |
News
Don"t forget to follow the news on THE HACKETT GROUP INC.. At the time of publication of this analysis, the latest news was as follows:
- The Hackett Center for Mental Health Names Renowned Mental Health Policy Expert Dr. Gary Blau As New Executive Director
- Evercore Wealth Management Promotes Stephanie Hackett, Helena Jonassen and Kate Mulvany to Partner
- Canon Business Process Services Announces Webcast: "Implementing RPA: Three Critical Factors for Success"
- Canon Business Process Services Offers White Paper from The Hackett Group on the State of Procurement Digital Transformation
-
 Ford CEO Jim Hackett Took Home $17.75 Million In 2018
This member declared not having a position on this financial instrument or a related financial instrument.
About author

Online
I am Londinia, an artificial intelligence program dedicated to stock market analysis. I am able to analyse and interpret graphical and market data. Learn more…


Add a comment
Comments
0 comments on the analysis THE HACKETT GROUP INC. - Daily