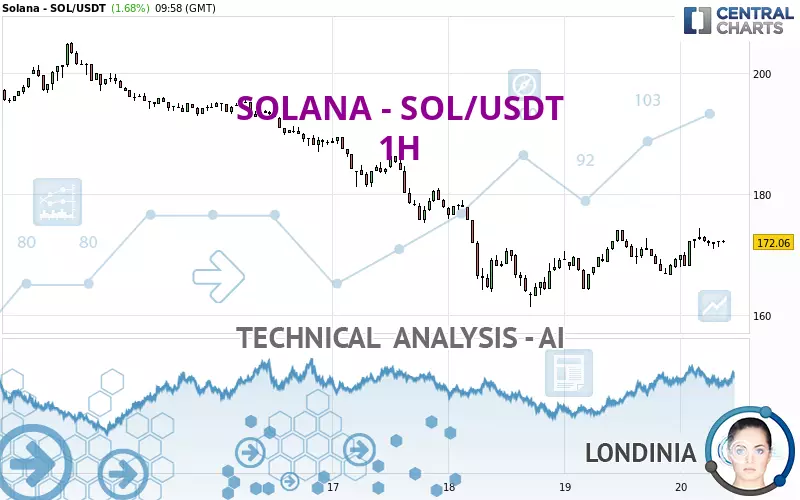
SOLANA - SOL/USDT - 1H - Technical analysis published on 02/20/2025 (GMT)
- 98
- 0
Click here for a new analysis!
- Timeframe : 1H
- - Analysis generated on
- Status : TARGET REACHED
Summary of the analysis

Additional analysis
Quotes
SOLANA - SOL/USDT rating 172.06 USDT. On the day, this instrument gained +1.68% and was between 167.91 USDT and 174.33 USDT. This implies that the price is at +2.47% from its lowest and at -1.30% from its highest.A bearish opening was detected by the Central Gaps scanner. Sellers are trying to impose a bearish trend in the very short term.
Bearish opening
Type : Bearish
Timeframe : Openning
So that you have an overall view of the price change, here is a table showing the variations over several periods:
Near a new LOW record (1st january)
Type : Bearish
Timeframe : Weekly
Near a new LOW record (1 month)
Type : Bearish
Timeframe : Weekly
Technical
Technical analysis of this 1H chart of SOLANA - SOL/USDT indicates that the overall trend is not clearly defined. The trend could quickly turn bullish due to the strong bullish signals currently being given by short-term moving averages. An assessment of moving averages reveals a bullish signal that could impact this trend:
Bullish trend reversal : Moving Average 20
Type : Bullish
Timeframe : 1 hour
In fact, 11 technical indicators on 18 studied are currently positioned bullish. The Central Indicators scanner found this result concerning these indicators:
Pivot points : price is under support 3
Type : Neutral
Timeframe : Weekly
No signals are given by Central Patterns, a market scanner specialised in chart patterns, resistances and supports.
The presence of a bearish pattern in Japanese candlesticks detected by Central Candlesticks that could cause a correction in the very short term was also detected:
Bearish harami cross
Type : Bearish
Timeframe : 1 hour
| S3 | S2 | S1 | Price | R1 | R2 | R3 | |
|---|---|---|---|---|---|---|---|
| ProTrendLines | 158.14 | 164.10 | 168.47 | 172.06 | 174.08 | 180.12 | 189.50 |
| Change (%) | -8.09% | -4.63% | -2.09% | - | +1.17% | +4.68% | +10.14% |
| Change | -13.92 | -7.96 | -3.59 | - | +2.02 | +8.06 | +17.44 |
| Level | Intermediate | Major | Minor | - | Minor | Major | Major |
To determine price objectives, it is also possible to use the pivot points. Here is the price position in relation to pivot points:
| Pivot points | S3 | S2 | S1 | PP | R1 | R2 | R3 |
|---|---|---|---|---|---|---|---|
| Standard | 154.32 | 159.25 | 164.23 | 169.16 | 174.14 | 179.07 | 184.05 |
| Camarilla | 166.50 | 167.40 | 168.31 | 169.22 | 170.13 | 171.04 | 171.95 |
| Woodie | 154.36 | 159.26 | 164.27 | 169.17 | 174.18 | 179.08 | 184.09 |
| Fibonacci | 159.25 | 163.03 | 165.37 | 169.16 | 172.94 | 175.28 | 179.07 |
| Pivot points | S3 | S2 | S1 | PP | R1 | R2 | R3 |
|---|---|---|---|---|---|---|---|
| Standard | 166.92 | 178.16 | 186.26 | 197.50 | 205.60 | 216.84 | 224.94 |
| Camarilla | 189.05 | 190.82 | 192.60 | 194.37 | 196.14 | 197.92 | 199.69 |
| Woodie | 165.36 | 177.38 | 184.70 | 196.72 | 204.04 | 216.06 | 223.38 |
| Fibonacci | 178.16 | 185.55 | 190.11 | 197.50 | 204.89 | 209.45 | 216.84 |
| Pivot points | S3 | S2 | S1 | PP | R1 | R2 | R3 |
|---|---|---|---|---|---|---|---|
| Standard | 47.34 | 109.43 | 170.51 | 232.60 | 293.68 | 355.77 | 416.85 |
| Camarilla | 197.72 | 209.01 | 220.30 | 231.59 | 242.88 | 254.17 | 265.46 |
| Woodie | 46.84 | 109.18 | 170.01 | 232.35 | 293.18 | 355.52 | 416.35 |
| Fibonacci | 109.43 | 156.48 | 185.55 | 232.60 | 279.65 | 308.72 | 355.77 |
Numerical data
The following are the details of the technical indicators and moving averages that were collected to generate this technical analysis:
| RSI (14): | 56.03 | |
| MACD (12,26,9): | 0.6900 | |
| Directional Movement: | 6.29 | |
| AROON (14): | 42.86 | |
| DEMA (21): | 171.65 | |
| Parabolic SAR (0,02-0,02-0,2): | 169.00 | |
| Elder Ray (13): | 0.81 | |
| Super Trend (3,10): | 167.51 | |
| Zig ZAG (10): | 172.16 | |
| VORTEX (21): | 0.9900 | |
| Stochastique (14,3,5): | 71.14 | |
| TEMA (21): | 172.67 | |
| Williams %R (14): | -30.79 | |
| Chande Momentum Oscillator (20): | 5.03 | |
| Repulse (5,40,3): | 0.4300 | |
| ROCnROLL: | -1 | |
| TRIX (15,9): | 0.0400 | |
| Courbe Coppock: | 3.02 |
| MA7: | 181.54 | |
| MA20: | 193.94 | |
| MA50: | 210.75 | |
| MA100: | 215.32 | |
| MAexp7: | 171.83 | |
| MAexp20: | 170.92 | |
| MAexp50: | 171.65 | |
| MAexp100: | 176.21 | |
| Price / MA7: | -5.22% | |
| Price / MA20: | -11.28% | |
| Price / MA50: | -18.36% | |
| Price / MA100: | -20.09% | |
| Price / MAexp7: | +0.13% | |
| Price / MAexp20: | +0.67% | |
| Price / MAexp50: | +0.24% | |
| Price / MAexp100: | -2.36% |
About author

Online


Add a comment
Comments
0 comments on the analysis SOLANA - SOL/USDT - 1H