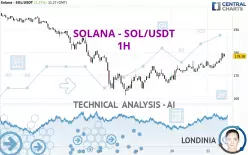
SOLANA - SOL/USDT - 1H - Technical analysis published on 02/21/2025 (GMT)
- 182
- 0
Click here for a new analysis!
- Timeframe : 1H
- - Analysis generated on
- Status : INVALID

Summary of the analysis

Additional analysis
Quotes
The SOLANA - SOL/USDT rating is 178.38 USDT. The price registered an increase of +1.37% on the session and was traded between 173.16 USDT and 179.80 USDT over the period. The price is currently at +3.01% from its lowest and -0.79% from its highest.The Central Gaps scanner detects a bullish opening marking the presence of buyers ahead of sellers at the opening but not sufficiently marked to allow the price to register a quotation gap.
Bullish opening
Type : Bullish
Timeframe : Openning
So that you have an overall view of the price change, here is a table showing the variations over several periods:
Technical
A technical analysis in 1H of this SOLANA - SOL/USDT chart shows a bullish trend. 71.43% of the signals given by moving averages are bullish. The overall trend is reinforced by the strong bullish signals from short-term moving averages. There is no crossing of moving average by the price or crossing of moving averages between themselves.
The probability of a further increase is high given the direction of the technical indicators.
Caution: the Central Indicators scanner currently detects an excess:
RSI indicator is overbought : over 70
Type : Neutral
Timeframe : 1 hour
CCI indicator is overbought : over 100
Type : Neutral
Timeframe : 1 hour
Previous candle closed over Bollinger bands
Type : Neutral
Timeframe : 1 hour
Williams %R indicator is overbought : over -20
Type : Neutral
Timeframe : 1 hour
Pivot points : price is under support 2
Type : Neutral
Timeframe : Weekly
Central Patterns, the market scanner focusing on chart patterns, resistances and supports found this result:
Resistance of channel is broken
Type : Bullish
Timeframe : 1 hour
The presence of these bearish patterns in Japanese candlesticks detected by Central Candlesticks that could cause a correction in the very short term were also noted
Bearish harami
Type : Bearish
Timeframe : 1 hour
Bearish harami cross
Type : Bearish
Timeframe : 1 hour
| S3 | S2 | S1 | Price | R1 | R2 | R3 | |
|---|---|---|---|---|---|---|---|
| ProTrendLines | 158.14 | 171.43 | 176.25 | 178.38 | 180.12 | 189.46 | 196.12 |
| Change (%) | -11.35% | -3.90% | -1.19% | - | +0.98% | +6.21% | +9.95% |
| Change | -20.24 | -6.95 | -2.13 | - | +1.74 | +11.08 | +17.74 |
| Level | Major | Intermediate | Intermediate | - | Intermediate | Minor | Minor |
To determine price objectives, it is also possible to use the pivot points. Here is the price position in relation to pivot points:
| Pivot points | S3 | S2 | S1 | PP | R1 | R2 | R3 |
|---|---|---|---|---|---|---|---|
| Standard | 162.04 | 164.98 | 170.47 | 173.41 | 178.90 | 181.84 | 187.33 |
| Camarilla | 173.65 | 174.43 | 175.20 | 175.97 | 176.74 | 177.52 | 178.29 |
| Woodie | 163.33 | 165.62 | 171.76 | 174.05 | 180.19 | 182.48 | 188.62 |
| Fibonacci | 164.98 | 168.20 | 170.19 | 173.41 | 176.63 | 178.62 | 181.84 |
| Pivot points | S3 | S2 | S1 | PP | R1 | R2 | R3 |
|---|---|---|---|---|---|---|---|
| Standard | 166.92 | 178.16 | 186.26 | 197.50 | 205.60 | 216.84 | 224.94 |
| Camarilla | 189.05 | 190.82 | 192.60 | 194.37 | 196.14 | 197.92 | 199.69 |
| Woodie | 165.36 | 177.38 | 184.70 | 196.72 | 204.04 | 216.06 | 223.38 |
| Fibonacci | 178.16 | 185.55 | 190.11 | 197.50 | 204.89 | 209.45 | 216.84 |
| Pivot points | S3 | S2 | S1 | PP | R1 | R2 | R3 |
|---|---|---|---|---|---|---|---|
| Standard | 47.34 | 109.43 | 170.51 | 232.60 | 293.68 | 355.77 | 416.85 |
| Camarilla | 197.72 | 209.01 | 220.30 | 231.59 | 242.88 | 254.17 | 265.46 |
| Woodie | 46.84 | 109.18 | 170.01 | 232.35 | 293.18 | 355.52 | 416.35 |
| Fibonacci | 109.43 | 156.48 | 185.55 | 232.60 | 279.65 | 308.72 | 355.77 |
Numerical data
The following is the status of technical indicators and moving averages registered at the time this technical analysis was created:
| RSI (14): | 65.25 | |
| MACD (12,26,9): | 1.2200 | |
| Directional Movement: | 28.67 | |
| AROON (14): | 50.00 | |
| DEMA (21): | 176.35 | |
| Parabolic SAR (0,02-0,02-0,2): | 173.27 | |
| Elder Ray (13): | 2.06 | |
| Super Trend (3,10): | 173.29 | |
| Zig ZAG (10): | 177.35 | |
| VORTEX (21): | 1.1300 | |
| Stochastique (14,3,5): | 69.96 | |
| TEMA (21): | 176.86 | |
| Williams %R (14): | -35.54 | |
| Chande Momentum Oscillator (20): | 3.58 | |
| Repulse (5,40,3): | 0.0800 | |
| ROCnROLL: | 1 | |
| TRIX (15,9): | 0.0800 | |
| Courbe Coppock: | 2.59 |
| MA7: | 178.98 | |
| MA20: | 192.31 | |
| MA50: | 210.22 | |
| MA100: | 214.99 | |
| MAexp7: | 176.37 | |
| MAexp20: | 174.83 | |
| MAexp50: | 173.56 | |
| MAexp100: | 175.49 | |
| Price / MA7: | -0.34% | |
| Price / MA20: | -7.24% | |
| Price / MA50: | -15.15% | |
| Price / MA100: | -17.03% | |
| Price / MAexp7: | +1.14% | |
| Price / MAexp20: | +2.03% | |
| Price / MAexp50: | +2.78% | |
| Price / MAexp100: | +1.65% |
About author

Online


Add a comment
Comments
0 comments on the analysis SOLANA - SOL/USDT - 1H