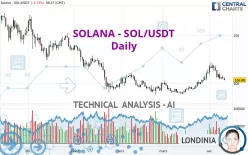
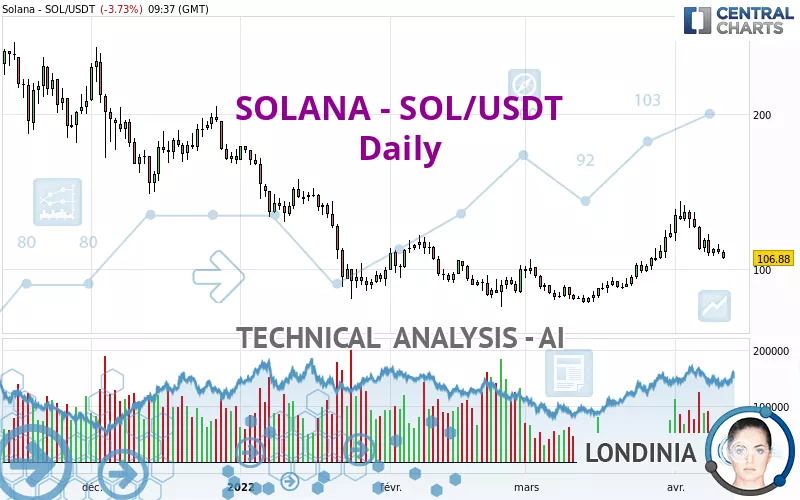
SOLANA - SOL/USDT - Daily - Technical analysis published on 04/11/2022 (GMT)
- 178
- 0
Click here for a new analysis!
- Timeframe : Daily
- - Analysis generated on
- Status : TARGET REACHED
Summary of the analysis

Additional analysis
Quotes
The SOLANA - SOL/USDT rating is 106.89 USDT. The price registered a decrease of -3.72% on the session and was between 106.21 USDT and 111.91 USDT. This implies that the price is at +0.64% from its lowest and at -4.49% from its highest.The Central Gaps scanner detects a bullish opening marking the presence of buyers ahead of sellers at the opening but not sufficiently marked to allow the price to register a quotation gap.
Bullish opening
Type : Bullish
Timeframe : Openning
So that you have an overall view of the price change, here is a table showing the variations over several periods:
Technical
A technical analysis in Daily of this SOLANA - SOL/USDT chart shows a bearish trend. 64.29% of the signals given by moving averages are bearish. Caution: the neutral signals currently given by short-term moving averages show us that the global trend is losing momentum. The Central Indicators scanner detects bearish signals on moving averages that could impact this trend:
Bearish price crossover with Moving Average 100
Type : Bearish
Timeframe : Daily
Bearish price crossover with adaptative moving average 100
Type : Bearish
Timeframe : Daily
The probability of a further decline is low given the direction of the technical indicators.
But beware of excesses. The Central Indicators scanner currently detects this:
Williams %R indicator is oversold : under -80
Type : Neutral
Timeframe : Daily
Pivot points : price is under support 1
Type : Neutral
Timeframe : Daily
RSI indicator is back under 50
Type : Bearish
Timeframe : Daily
SuperTrend indicator bearish reversal
Type : Bearish
Timeframe : Daily
The analysis of the price chart with Central Patterns scanners does not return any result.
The Central Candlesticks scanner which studies Japanese candlesticks did not detect anything.
| S3 | S2 | S1 | Price | R1 | R2 | R3 | |
|---|---|---|---|---|---|---|---|
| ProTrendLines | 23.58 | 56.02 | 89.53 | 106.89 | 117.52 | 155.05 | 191.11 |
| Change (%) | -77.94% | -47.59% | -16.24% | - | +9.94% | +45.06% | +78.79% |
| Change | -83.31 | -50.87 | -17.36 | - | +10.63 | +48.16 | +84.22 |
| Level | Intermediate | Intermediate | Major | - | Minor | Minor | Intermediate |
Attention could also be paid to pivot points to set price objectives:
| Pivot points | S3 | S2 | S1 | PP | R1 | R2 | R3 |
|---|---|---|---|---|---|---|---|
| Standard | 102.31 | 106.05 | 108.53 | 112.27 | 114.75 | 118.49 | 120.97 |
| Camarilla | 109.31 | 109.88 | 110.45 | 111.02 | 111.59 | 112.16 | 112.73 |
| Woodie | 101.69 | 105.74 | 107.91 | 111.96 | 114.13 | 118.18 | 120.35 |
| Fibonacci | 106.05 | 108.42 | 109.89 | 112.27 | 114.64 | 116.11 | 118.49 |
| Pivot points | S3 | S2 | S1 | PP | R1 | R2 | R3 |
|---|---|---|---|---|---|---|---|
| Standard | 67.52 | 87.85 | 100.39 | 120.72 | 133.26 | 153.59 | 166.13 |
| Camarilla | 103.89 | 106.90 | 109.92 | 112.93 | 115.94 | 118.96 | 121.97 |
| Woodie | 63.63 | 85.90 | 96.50 | 118.77 | 129.37 | 151.64 | 162.24 |
| Fibonacci | 87.85 | 100.41 | 108.16 | 120.72 | 133.28 | 141.03 | 153.59 |
| Pivot points | S3 | S2 | S1 | PP | R1 | R2 | R3 |
|---|---|---|---|---|---|---|---|
| Standard | 39.64 | 58.77 | 90.84 | 109.97 | 142.04 | 161.17 | 193.24 |
| Camarilla | 108.82 | 113.51 | 118.21 | 122.90 | 127.59 | 132.29 | 136.98 |
| Woodie | 46.10 | 62.01 | 97.30 | 113.21 | 148.50 | 164.41 | 199.70 |
| Fibonacci | 58.77 | 78.33 | 90.42 | 109.97 | 129.53 | 141.62 | 161.17 |
Numerical data
The following are the details of the technical indicators and moving averages that were collected to generate this technical analysis:
| RSI (14): | 47.40 | |
| MACD (12,26,9): | 4.3200 | |
| Directional Movement: | 2.59 | |
| AROON (14): | 35.71 | |
| DEMA (21): | 119.26 | |
| Parabolic SAR (0,02-0,02-0,2): | 132.96 | |
| Elder Ray (13): | -5.31 | |
| Super Trend (3,10): | 137.28 | |
| Zig ZAG (10): | 106.51 | |
| VORTEX (21): | 1.0900 | |
| Stochastique (14,3,5): | 15.49 | |
| TEMA (21): | 119.82 | |
| Williams %R (14): | -99.52 | |
| Chande Momentum Oscillator (20): | -14.09 | |
| Repulse (5,40,3): | -11.3600 | |
| ROCnROLL: | 2 | |
| TRIX (15,9): | 1.0700 | |
| Courbe Coppock: | 20.93 |
| MA7: | 114.11 | |
| MA20: | 115.04 | |
| MA50: | 98.70 | |
| MA100: | 108.48 | |
| MAexp7: | 113.54 | |
| MAexp20: | 112.48 | |
| MAexp50: | 107.40 | |
| MAexp100: | 114.36 | |
| Price / MA7: | -6.33% | |
| Price / MA20: | -7.08% | |
| Price / MA50: | +8.30% | |
| Price / MA100: | -1.47% | |
| Price / MAexp7: | -5.86% | |
| Price / MAexp20: | -4.97% | |
| Price / MAexp50: | -0.47% | |
| Price / MAexp100: | -6.53% |
About author

Online


Add a comment
Comments
0 comments on the analysis SOLANA - SOL/USDT - Daily