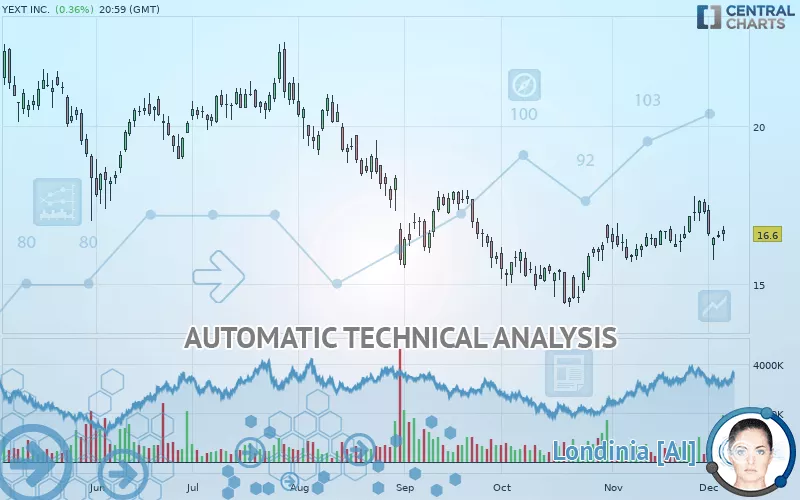
YEXT INC. - Daily - Technical analysis published on 12/06/2019 (GMT)
- 282
- 0
- Who voted?
Click here for a new analysis!
- Timeframe : Daily
- - Analysis generated on
- Status : INVALID
Summary of the analysis

Additional analysis
Quotes
The YEXT INC. rating is 16.60 USD. The price has increased by +0.36% since the last closing and was traded between 16.37 USD and 16.83 USD over the period. The price is currently at +1.41% from its lowest and -1.37% from its highest.The Central Gaps scanner detects a bullish gap which is a sign that buyers have taken the lead in the very short term.
Opening Gap UP
Type : Bullish
Timeframe : Openning
A study of price movements over other periods shows the following variations:
Near a new LOW record (1 month)
Type : Bearish
Timeframe : Weekly
Technical
Technical analysis of YEXT INC. in Daily shows a neutral overall trend. The strong bullish signals currently being given by short-term moving averages could allow the overall trend to return to bullish. There is no crossing of moving average by the price or crossing of moving averages between themselves.
On the 18 technical indicators analysed, 4 are bullish, 9 are neutral and 5 are bearish. Other results related to technical indicators were also found by the Central Indicators scanner:
Pivot points : price is under support 1
Type : Neutral
Timeframe : Weekly
RSI indicator is back over 50
Type : Bullish
Timeframe : Daily
MACD crosses DOWN its Moving Average
Type : Bearish
Timeframe : Daily
Price is back over the pivot point
Type : Bullish
Timeframe : Weekly
Momentum indicator is back under 0
Type : Bearish
Timeframe : Daily
Central Patterns, the scanner specializing in chart patterns, did not identify any signals.
The presence of a bearish pattern in Japanese candlesticks detected by Central Candlesticks that could cause a correction in the very short term was also detected:
Bearish doji star
Type : Bearish
Timeframe : Daily
| S3 | S2 | S1 | Price | R1 | R2 | R3 | |
|---|---|---|---|---|---|---|---|
| ProTrendLines | 13.32 | 14.53 | 16.06 | 16.60 | 17.82 | 18.98 | 20.06 |
| Change (%) | -19.76% | -12.47% | -3.25% | - | +7.35% | +14.34% | +20.84% |
| Change | -3.28 | -2.07 | -0.54 | - | +1.22 | +2.38 | +3.46 |
| Level | Intermediate | Major | Major | - | Major | Minor | Intermediate |
Pivot points can also be used to set your price objectives. Here is the price situation in relation to pivot points:
| Pivot points | S3 | S2 | S1 | PP | R1 | R2 | R3 |
|---|---|---|---|---|---|---|---|
| Standard | 16.22 | 16.33 | 16.44 | 16.55 | 16.66 | 16.77 | 16.88 |
| Camarilla | 16.48 | 16.50 | 16.52 | 16.54 | 16.56 | 16.58 | 16.60 |
| Woodie | 16.21 | 16.33 | 16.43 | 16.55 | 16.65 | 16.77 | 16.87 |
| Fibonacci | 16.33 | 16.42 | 16.47 | 16.55 | 16.64 | 16.69 | 16.77 |
| Pivot points | S3 | S2 | S1 | PP | R1 | R2 | R3 |
|---|---|---|---|---|---|---|---|
| Standard | 15.46 | 16.04 | 16.65 | 17.23 | 17.84 | 18.42 | 19.03 |
| Camarilla | 16.94 | 17.05 | 17.16 | 17.27 | 17.38 | 17.49 | 17.60 |
| Woodie | 15.49 | 16.05 | 16.68 | 17.24 | 17.87 | 18.43 | 19.06 |
| Fibonacci | 16.04 | 16.49 | 16.77 | 17.23 | 17.68 | 17.96 | 18.42 |
| Pivot points | S3 | S2 | S1 | PP | R1 | R2 | R3 |
|---|---|---|---|---|---|---|---|
| Standard | 13.96 | 14.83 | 16.05 | 16.93 | 18.15 | 19.02 | 20.24 |
| Camarilla | 16.69 | 16.89 | 17.08 | 17.27 | 17.46 | 17.65 | 17.85 |
| Woodie | 14.13 | 14.92 | 16.22 | 17.01 | 18.32 | 19.11 | 20.41 |
| Fibonacci | 14.83 | 15.63 | 16.13 | 16.93 | 17.73 | 18.22 | 19.02 |
Numerical data
The following are the details of the technical indicators and moving averages that were collected to generate this technical analysis:
| RSI (14): | 51.50 | |
| MACD (12,26,9): | 0.1800 | |
| Directional Movement: | 0.32 | |
| AROON (14): | -28.57 | |
| DEMA (21): | 16.83 | |
| Parabolic SAR (0,02-0,02-0,2): | 17.72 | |
| Elder Ray (13): | -0.08 | |
| Super Trend (3,10): | 15.87 | |
| Zig ZAG (10): | 16.60 | |
| VORTEX (21): | 1.0100 | |
| Stochastique (14,3,5): | 38.37 | |
| TEMA (21): | 16.98 | |
| Williams %R (14): | -58.54 | |
| Chande Momentum Oscillator (20): | -0.05 | |
| Repulse (5,40,3): | -0.6300 | |
| ROCnROLL: | 2 | |
| TRIX (15,9): | 0.2200 | |
| Courbe Coppock: | 6.03 |
| MA7: | 16.91 | |
| MA20: | 16.59 | |
| MA50: | 15.99 | |
| MA100: | 17.43 | |
| MAexp7: | 16.71 | |
| MAexp20: | 16.58 | |
| MAexp50: | 16.56 | |
| MAexp100: | 17.17 | |
| Price / MA7: | -1.83% | |
| Price / MA20: | +0.06% | |
| Price / MA50: | +3.81% | |
| Price / MA100: | -4.76% | |
| Price / MAexp7: | -0.66% | |
| Price / MAexp20: | +0.12% | |
| Price / MAexp50: | +0.24% | |
| Price / MAexp100: | -3.32% |
About author

Online


Add a comment
Comments
0 comments on the analysis YEXT INC. - Daily