CADENCE BANK - Daily - Technical analysis published on 11/29/2019 (GMT)
- 294
- 0
- Who voted?
- Timeframe : Daily
- - Analysis generated on
- Status : NEUTRAL

Summary of the analysis

Additional analysis
Quotes
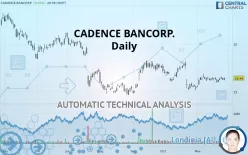
The CADENCE BANCORP. price is 16.44 USD. On the day, this instrument gained +0.92% and was traded between 16.22 USD and 16.49 USD over the period. The price is currently at +1.36% from its lowest and -0.30% from its highest.The Central Gaps scanner detects a bearish opening. A small advantage for sellers in the very short term.
Bearish opening
Type : Bearish
Timeframe : Openning
Here is a more detailed summary of the historical variations registered by CADENCE BANCORP.:
Near a new HIGH record (1 month)
Type : Bullish
Timeframe : Weekly
Technical
A technical analysis in Daily of this CADENCE BANCORP. chart shows a slightly bearish trend. Only 53.57% of the signals given by moving averages are bearish. This slightly bearish trend could turn neutral or reverse given the slightly bullish signals currently being given by short-term moving averages. The Central Indicators scanner detects a bearish signal on moving averages that could impact this trend:
Bearish price crossover with adaptative moving average 20
Type : Bearish
Timeframe : Daily
An assessment of technical indicators shows a strong bullish signal.
Caution: the Central Indicators scanner currently detects an excess:
Williams %R indicator is overbought : over -20
Type : Neutral
Timeframe : Daily
Pivot points : price is over resistance 1
Type : Neutral
Timeframe : Weekly
Momentum indicator is back over 0
Type : Bullish
Timeframe : Daily
The analysis of the price chart with Central Patterns scanners does not return any result.
Central Candlesticks, the scanner specialised in Japanese candlesticks, detects this inversion signal that could impact the current short-term trend:
White gravestone / inverted hammer
Type : Neutral
Timeframe : Daily
| S2 | S1 | Price | R1 | R2 | R3 | |
|---|---|---|---|---|---|---|
| ProTrendLines | 14.82 | 16.30 | 16.44 | 18.05 | 20.79 | 23.04 |
| Change (%) | -9.85% | -0.85% | - | +9.79% | +26.46% | +40.15% |
| Change | -1.62 | -0.14 | - | +1.61 | +4.35 | +6.60 |
| Level | Intermediate | Major | - | Major | Intermediate | Major |
Attention could also be paid to pivot points to set price objectives:
| Pivot points | S3 | S2 | S1 | PP | R1 | R2 | R3 |
|---|---|---|---|---|---|---|---|
| Standard | 15.91 | 16.08 | 16.18 | 16.35 | 16.45 | 16.62 | 16.72 |
| Camarilla | 16.22 | 16.24 | 16.27 | 16.29 | 16.32 | 16.34 | 16.36 |
| Woodie | 15.89 | 16.06 | 16.16 | 16.33 | 16.43 | 16.60 | 16.70 |
| Fibonacci | 16.08 | 16.18 | 16.24 | 16.35 | 16.45 | 16.51 | 16.62 |
| Pivot points | S3 | S2 | S1 | PP | R1 | R2 | R3 |
|---|---|---|---|---|---|---|---|
| Standard | 15.25 | 15.51 | 15.84 | 16.10 | 16.44 | 16.69 | 17.03 |
| Camarilla | 16.02 | 16.07 | 16.13 | 16.18 | 16.23 | 16.29 | 16.34 |
| Woodie | 15.29 | 15.53 | 15.88 | 16.12 | 16.48 | 16.71 | 17.07 |
| Fibonacci | 15.51 | 15.73 | 15.87 | 16.10 | 16.33 | 16.47 | 16.69 |
| Pivot points | S3 | S2 | S1 | PP | R1 | R2 | R3 |
|---|---|---|---|---|---|---|---|
| Standard | 11.10 | 13.04 | 14.13 | 16.08 | 17.16 | 19.11 | 20.19 |
| Camarilla | 14.38 | 14.65 | 14.93 | 15.21 | 15.49 | 15.77 | 16.04 |
| Woodie | 10.66 | 12.83 | 13.70 | 15.86 | 16.73 | 18.89 | 19.76 |
| Fibonacci | 13.04 | 14.20 | 14.92 | 16.08 | 17.23 | 17.95 | 19.11 |
Numerical data
The following are the details of the technical indicators and moving averages that were collected to generate this technical analysis:
| RSI (14): | 54.08 | |
| MACD (12,26,9): | -0.0100 | |
| Directional Movement: | 1.77 | |
| AROON (14): | -64.29 | |
| DEMA (21): | 16.15 | |
| Parabolic SAR (0,02-0,02-0,2): | 15.28 | |
| Elder Ray (13): | 0.16 | |
| Super Trend (3,10): | 16.94 | |
| Zig ZAG (10): | 16.44 | |
| VORTEX (21): | 1.0300 | |
| Stochastique (14,3,5): | 68.08 | |
| TEMA (21): | 16.23 | |
| Williams %R (14): | -9.38 | |
| Chande Momentum Oscillator (20): | 0.22 | |
| Repulse (5,40,3): | 1.3000 | |
| ROCnROLL: | 1 | |
| TRIX (15,9): | -0.0700 | |
| Courbe Coppock: | 2.52 |
| MA7: | 16.17 | |
| MA20: | 16.11 | |
| MA50: | 16.50 | |
| MA100: | 16.42 | |
| MAexp7: | 16.25 | |
| MAexp20: | 16.20 | |
| MAexp50: | 16.35 | |
| MAexp100: | 16.78 | |
| Price / MA7: | +1.67% | |
| Price / MA20: | +2.05% | |
| Price / MA50: | -0.36% | |
| Price / MA100: | +0.12% | |
| Price / MAexp7: | +1.17% | |
| Price / MAexp20: | +1.48% | |
| Price / MAexp50: | +0.55% | |
| Price / MAexp100: | -2.03% |
About author

Online


Add a comment
Comments
0 comments on the analysis CADENCE BANK - Daily