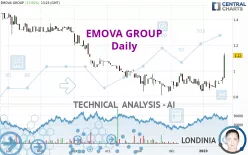
EMOVA GROUP - Daily - Technical analysis published on 01/20/2023 (GMT)
- 188
- 0
Click here for a new analysis!
- Timeframe : Daily
- - Analysis generated on
- Status : INVALID

Summary of the analysis
Additional analysis
Quotes
The EMOVA GROUP rating is 1.120 EUR. On the day, this instrument gained +17.65% with the lowest point at 0.948 EUR and the highest point at 1.140 EUR. The deviation from the price is +18.14% for the low point and -1.75% for the high point.A bearish opening was detected by the Central Gaps scanner. Sellers are trying to impose a bearish trend in the very short term.
Bearish opening
Type : Bearish
Timeframe : Openning
A study of price movements over other periods shows the following variations:
New HIGH record (1st january)
Type : Bullish
Timeframe : Weekly
New HIGH record (1 month)
Type : Bullish
Timeframe : Weekly
Technical
Technical analysis of EMOVA GROUP in Daily shows an overall slightly bullish trend. 60.71% of the signals given by moving averages are bullish. This slightly bullish trend could be reinforced by the strong bullish signals given by short-term moving averages. An assessment of moving averages reveals several bullish signals that could impact this trend:
Bullish trend reversal : Moving Average 50
Type : Bullish
Timeframe : Daily
Moving Average bullish crossovers : AMA50 & AMA100
Type : Bullish
Timeframe : Daily
Bullish price crossover with Moving Average 100
Type : Bullish
Timeframe : Daily
In fact, according to the parameters integrated into the Central Analyzer system, 15 technical indicators out of 18 analysed are currently bullish. Caution: the Central Indicators scanner currently detects an excess:
RSI indicator is overbought : over 70
Type : Neutral
Timeframe : Daily
CCI indicator is overbought : over 100
Type : Neutral
Timeframe : Daily
Williams %R indicator is overbought : over -20
Type : Neutral
Timeframe : Daily
Pivot points : price is over resistance 3
Type : Neutral
Timeframe : Daily
Pivot points : price is over resistance 3
Type : Neutral
Timeframe : Weekly
SuperTrend indicator bullish reversal
Type : Bullish
Timeframe : Daily
An analysis of the price chart with the Central Patterns scanner (detector of chart patterns and resistances and supports) shows several results that can have an impact on the price change:
Horizontal resistance is broken
Type : Bullish
Timeframe : Daily
Resistance of channel is broken
Type : Bullish
Timeframe : Daily
For a small rebound in the very short term, the Central Candlesticks scanner currently notes the presence of these bullish patterns in Japanese candlesticks:
White line without lower shadow
Type : Bullish
Timeframe : Daily
Long white line
Type : Bullish
Timeframe : Daily
| S2 | S1 | Price | R1 | R2 | R3 | |
|---|---|---|---|---|---|---|
| ProTrendLines | 0.786 | 0.978 | 1.120 | 1.300 | 1.520 | 1.638 |
| Change (%) | -29.82% | -12.68% | - | +16.07% | +35.71% | +46.25% |
| Change | -0.334 | -0.142 | - | +0.180 | +0.400 | +0.518 |
| Level | Major | Minor | - | Intermediate | Intermediate | Intermediate |
Pivot points can also be used to set your price objectives. Here is the price situation in relation to pivot points:
| Pivot points | S3 | S2 | S1 | PP | R1 | R2 | R3 |
|---|---|---|---|---|---|---|---|
| Standard | 0.865 | 0.883 | 0.917 | 0.935 | 0.969 | 0.987 | 1.021 |
| Camarilla | 0.938 | 0.943 | 0.947 | 0.952 | 0.957 | 0.962 | 0.966 |
| Woodie | 0.874 | 0.887 | 0.926 | 0.939 | 0.978 | 0.991 | 1.030 |
| Fibonacci | 0.883 | 0.903 | 0.915 | 0.935 | 0.955 | 0.967 | 0.987 |
| Pivot points | S3 | S2 | S1 | PP | R1 | R2 | R3 |
|---|---|---|---|---|---|---|---|
| Standard | 0.823 | 0.847 | 0.883 | 0.907 | 0.943 | 0.967 | 1.003 |
| Camarilla | 0.904 | 0.909 | 0.915 | 0.920 | 0.926 | 0.931 | 0.937 |
| Woodie | 0.830 | 0.850 | 0.890 | 0.910 | 0.950 | 0.970 | 1.010 |
| Fibonacci | 0.847 | 0.870 | 0.884 | 0.907 | 0.930 | 0.944 | 0.967 |
| Pivot points | S3 | S2 | S1 | PP | R1 | R2 | R3 |
|---|---|---|---|---|---|---|---|
| Standard | 0.663 | 0.753 | 0.799 | 0.889 | 0.935 | 1.025 | 1.071 |
| Camarilla | 0.807 | 0.819 | 0.832 | 0.844 | 0.857 | 0.869 | 0.881 |
| Woodie | 0.640 | 0.742 | 0.776 | 0.878 | 0.912 | 1.014 | 1.048 |
| Fibonacci | 0.753 | 0.805 | 0.837 | 0.889 | 0.941 | 0.973 | 1.025 |
Numerical data
The following are the details of the technical indicators and moving averages that were collected to generate this technical analysis:
| RSI (14): | 73.45 | |
| MACD (12,26,9): | 0.0190 | |
| Directional Movement: | 35.390 | |
| AROON (14): | 100.000 | |
| DEMA (21): | 0.944 | |
| Parabolic SAR (0,02-0,02-0,2): | 0.850 | |
| Elder Ray (13): | 0.104 | |
| Super Trend (3,10): | 0.906 | |
| Zig ZAG (10): | 1.120 | |
| VORTEX (21): | 0.9770 | |
| Stochastique (14,3,5): | 97.69 | |
| TEMA (21): | 0.971 | |
| Williams %R (14): | -6.94 | |
| Chande Momentum Oscillator (20): | 0.240 | |
| Repulse (5,40,3): | 22.9020 | |
| ROCnROLL: | 1 | |
| TRIX (15,9): | 0.0040 | |
| Courbe Coppock: | 14.41 |
| MA7: | 0.949 | |
| MA20: | 0.909 | |
| MA50: | 0.911 | |
| MA100: | 0.979 | |
| MAexp7: | 0.969 | |
| MAexp20: | 0.927 | |
| MAexp50: | 0.934 | |
| MAexp100: | 1.004 | |
| Price / MA7: | +18.02% | |
| Price / MA20: | +23.21% | |
| Price / MA50: | +22.94% | |
| Price / MA100: | +14.40% | |
| Price / MAexp7: | +15.58% | |
| Price / MAexp20: | +20.82% | |
| Price / MAexp50: | +19.91% | |
| Price / MAexp100: | +11.55% |
News
The latest news and videos published on EMOVA GROUP at the time of the analysis were as follows:
About author

Online


Add a comment
Comments
0 comments on the analysis EMOVA GROUP - Daily