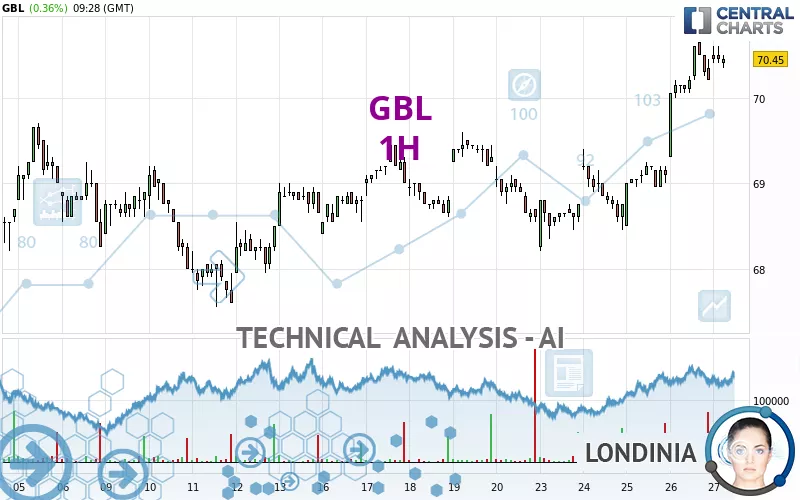
GBL - 1H - Technical analysis published on 09/27/2024 (GMT)
- 132
- 0
Click here for a new analysis!
- Timeframe : 1H
- - Analysis generated on
- Status : INVALID

Summary of the analysis

Additional analysis
Quotes
The GBL price is 70.45 EUR. On the day, this instrument gained +0.36% with the lowest point at 70.35 EUR and the highest point at 70.60 EUR. The deviation from the price is +0.14% for the low point and -0.21% for the high point.A study of price movements over other periods shows the following variations:
Near a new HIGH record (1 year)
Type : Bullish
Timeframe : Weekly
Near a new HIGH record (1st january)
Type : Bullish
Timeframe : Weekly
Near a new LOW record (1 month)
Type : Bearish
Timeframe : Weekly
Technical
A technical analysis in 1H of this GBL chart shows a strongly bullish trend. 92.86% of the signals given by moving averages are bullish. This strongly bullish trend is supported by the strong bullish signals given by short-term moving averages. The Central Indicators scanner does not detect any result on moving averages that would impact this trend.
In fact, according to the parameters integrated into the Central Analyzer system, 13 technical indicators out of 18 analysed are currently bullish. Caution: the Central Indicators scanner currently detects an excess:
MACD indicator: bearish divergence
Type : Bearish
Timeframe : 1 hour
Williams %R indicator is overbought : over -20
Type : Neutral
Timeframe : 1 hour
Pivot points : price is over resistance 2
Type : Neutral
Timeframe : Weekly
Central Patterns, the scanner specializing in chart patterns, did not identify any signals.
Central Candlesticks, the scanner specialised in Japanese candlesticks, detects this inversion signal that could impact the current short-term trend:
Doji
Type : Neutral
Timeframe : 1 hour
| S3 | S2 | S1 | Price | R1 | R2 | R3 | |
|---|---|---|---|---|---|---|---|
| ProTrendLines | 68.95 | 69.40 | 69.75 | 70.45 | 71.00 | 71.55 | 75.70 |
| Change (%) | -2.13% | -1.49% | -0.99% | - | +0.78% | +1.56% | +7.45% |
| Change | -1.50 | -1.05 | -0.70 | - | +0.55 | +1.10 | +5.25 |
| Level | Intermediate | Intermediate | Minor | - | Minor | Major | Intermediate |
To determine price objectives, it is also possible to use the pivot points. Here is the price position in relation to pivot points:
| Pivot points | S3 | S2 | S1 | PP | R1 | R2 | R3 |
|---|---|---|---|---|---|---|---|
| Standard | 68.10 | 68.70 | 69.45 | 70.05 | 70.80 | 71.40 | 72.15 |
| Camarilla | 69.83 | 69.95 | 70.08 | 70.20 | 70.32 | 70.45 | 70.57 |
| Woodie | 68.18 | 68.74 | 69.53 | 70.09 | 70.88 | 71.44 | 72.23 |
| Fibonacci | 68.70 | 69.22 | 69.53 | 70.05 | 70.57 | 70.88 | 71.40 |
| Pivot points | S3 | S2 | S1 | PP | R1 | R2 | R3 |
|---|---|---|---|---|---|---|---|
| Standard | 66.93 | 67.67 | 68.13 | 68.87 | 69.33 | 70.07 | 70.53 |
| Camarilla | 68.27 | 68.38 | 68.49 | 68.60 | 68.71 | 68.82 | 68.93 |
| Woodie | 66.80 | 67.60 | 68.00 | 68.80 | 69.20 | 70.00 | 70.40 |
| Fibonacci | 67.67 | 68.13 | 68.41 | 68.87 | 69.33 | 69.61 | 70.07 |
| Pivot points | S3 | S2 | S1 | PP | R1 | R2 | R3 |
|---|---|---|---|---|---|---|---|
| Standard | 57.82 | 61.08 | 65.42 | 68.68 | 73.02 | 76.28 | 80.62 |
| Camarilla | 67.66 | 68.36 | 69.05 | 69.75 | 70.45 | 71.14 | 71.84 |
| Woodie | 58.35 | 61.35 | 65.95 | 68.95 | 73.55 | 76.55 | 81.15 |
| Fibonacci | 61.08 | 63.99 | 65.78 | 68.68 | 71.59 | 73.38 | 76.28 |
Numerical data
The following is the status of the technical indicators and moving averages at the time of publication of this technical analysis:
| RSI (14): | 67.05 | |
| MACD (12,26,9): | 0.3900 | |
| Directional Movement: | 17.87 | |
| AROON (14): | 64.29 | |
| DEMA (21): | 70.41 | |
| Parabolic SAR (0,02-0,02-0,2): | 69.86 | |
| Elder Ray (13): | 0.29 | |
| Super Trend (3,10): | 69.86 | |
| Zig ZAG (10): | 70.40 | |
| VORTEX (21): | 1.2900 | |
| Stochastique (14,3,5): | 87.25 | |
| TEMA (21): | 70.63 | |
| Williams %R (14): | -14.71 | |
| Chande Momentum Oscillator (20): | 1.25 | |
| Repulse (5,40,3): | -0.4700 | |
| ROCnROLL: | 1 | |
| TRIX (15,9): | 0.0700 | |
| Courbe Coppock: | 3.50 |
| MA7: | 69.29 | |
| MA20: | 68.87 | |
| MA50: | 68.15 | |
| MA100: | 68.47 | |
| MAexp7: | 70.33 | |
| MAexp20: | 69.93 | |
| MAexp50: | 69.45 | |
| MAexp100: | 69.16 | |
| Price / MA7: | +1.67% | |
| Price / MA20: | +2.29% | |
| Price / MA50: | +3.37% | |
| Price / MA100: | +2.89% | |
| Price / MAexp7: | +0.17% | |
| Price / MAexp20: | +0.74% | |
| Price / MAexp50: | +1.44% | |
| Price / MAexp100: | +1.87% |
News
The last news published on GBL at the time of the generation of this analysis was as follows:
About author

Online


Add a comment
Comments
0 comments on the analysis GBL - 1H