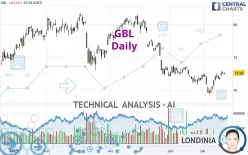
GBL - Daily - Technical analysis published on 07/21/2023 (GMT)
- 163
- 0
Click here for a new analysis!
- Timeframe : Daily
- - Analysis generated on
- Status : LEVEL MAINTAINED

Summary of the analysis

Additional analysis
Quotes
GBL rating 72.58 EUR. The price registered a decrease of -0.11% on the session and was between 72.30 EUR and 72.64 EUR. This implies that the price is at +0.39% from its lowest and at -0.08% from its highest.The Central Gaps scanner detects a bearish gap which is a sign that the sellers have taken the lead in the very short term.
Opening Gap DOWN
Type : Bearish
Timeframe : Openning
So that you have an overall view of the price change, here is a table showing the variations over several periods:
Near a new LOW record (1st january)
Type : Bearish
Timeframe : Weekly
Near a new LOW record (1 month)
Type : Bearish
Timeframe : Weekly
Technical
A technical analysis in Daily of this GBL chart shows a bearish trend. The signals given by moving averages are 71.43% bearish. This bearish trend could slow down given the neutral signals currently being given by short-term moving averages. The Central Indicators scanner does not detect any result on moving averages that would impact this trend.
In fact, 13 technical indicators on 18 studied are currently positioned bullish. Caution: the Central Indicators scanner currently detects an excess:
Williams %R indicator is overbought : over -20
Type : Neutral
Timeframe : Daily
Ichimoku - Bullish crossover : Tenkan & Kijun
Type : Bullish
Timeframe : Daily
Central Patterns, the market scanner focusing on chart patterns, resistances and supports found this result:
Near resistance of channel
Type : Bearish
Timeframe : Daily
The Central Candlesticks scanner which studies Japanese candlesticks did not detect anything.
| S3 | S2 | S1 | Price | R1 | R2 | R3 | |
|---|---|---|---|---|---|---|---|
| ProTrendLines | 69.62 | 71.40 | 72.33 | 72.58 | 73.46 | 75.82 | 76.87 |
| Change (%) | -4.08% | -1.63% | -0.34% | - | +1.21% | +4.46% | +5.91% |
| Change | -2.96 | -1.18 | -0.25 | - | +0.88 | +3.24 | +4.29 |
| Level | Minor | Major | Major | - | Minor | Minor | Intermediate |
To determine price objectives, it is also possible to use the pivot points. Here is the price position in relation to pivot points:
| Pivot points | S3 | S2 | S1 | PP | R1 | R2 | R3 |
|---|---|---|---|---|---|---|---|
| Standard | 71.96 | 72.22 | 72.44 | 72.70 | 72.92 | 73.18 | 73.40 |
| Camarilla | 72.53 | 72.57 | 72.62 | 72.66 | 72.70 | 72.75 | 72.79 |
| Woodie | 71.94 | 72.21 | 72.42 | 72.69 | 72.90 | 73.17 | 73.38 |
| Fibonacci | 72.22 | 72.40 | 72.52 | 72.70 | 72.88 | 73.00 | 73.18 |
| Pivot points | S3 | S2 | S1 | PP | R1 | R2 | R3 |
|---|---|---|---|---|---|---|---|
| Standard | 67.22 | 68.34 | 70.30 | 71.42 | 73.38 | 74.50 | 76.46 |
| Camarilla | 71.41 | 71.70 | 71.98 | 72.26 | 72.54 | 72.83 | 73.11 |
| Woodie | 67.64 | 68.55 | 70.72 | 71.63 | 73.80 | 74.71 | 76.88 |
| Fibonacci | 68.34 | 69.52 | 70.24 | 71.42 | 72.60 | 73.32 | 74.50 |
| Pivot points | S3 | S2 | S1 | PP | R1 | R2 | R3 |
|---|---|---|---|---|---|---|---|
| Standard | 67.75 | 69.27 | 70.71 | 72.23 | 73.67 | 75.19 | 76.63 |
| Camarilla | 71.35 | 71.62 | 71.89 | 72.16 | 72.43 | 72.70 | 72.97 |
| Woodie | 67.72 | 69.25 | 70.68 | 72.21 | 73.64 | 75.17 | 76.60 |
| Fibonacci | 69.27 | 70.40 | 71.10 | 72.23 | 73.36 | 74.06 | 75.19 |
Numerical data
The following are the details of the technical indicators and moving averages that were collected to generate this technical analysis:
| RSI (14): | 54.33 | |
| MACD (12,26,9): | -0.0900 | |
| Directional Movement: | 4.99 | |
| AROON (14): | 64.29 | |
| DEMA (21): | 71.60 | |
| Parabolic SAR (0,02-0,02-0,2): | 70.06 | |
| Elder Ray (13): | 0.56 | |
| Super Trend (3,10): | 70.44 | |
| Zig ZAG (10): | 72.54 | |
| VORTEX (21): | 1.0300 | |
| Stochastique (14,3,5): | 91.45 | |
| TEMA (21): | 72.14 | |
| Williams %R (14): | -10.05 | |
| Chande Momentum Oscillator (20): | 1.64 | |
| Repulse (5,40,3): | 0.8400 | |
| ROCnROLL: | -1 | |
| TRIX (15,9): | -0.0800 | |
| Courbe Coppock: | 1.83 |
| MA7: | 72.26 | |
| MA20: | 71.52 | |
| MA50: | 72.76 | |
| MA100: | 74.31 | |
| MAexp7: | 72.18 | |
| MAexp20: | 71.90 | |
| MAexp50: | 72.73 | |
| MAexp100: | 73.65 | |
| Price / MA7: | +0.44% | |
| Price / MA20: | +1.48% | |
| Price / MA50: | -0.25% | |
| Price / MA100: | -2.33% | |
| Price / MAexp7: | +0.55% | |
| Price / MAexp20: | +0.95% | |
| Price / MAexp50: | -0.21% | |
| Price / MAexp100: | -1.45% |
News
The latest news and videos published on GBL at the time of the analysis were as follows:
About author
Online


Add a comment
Comments
0 comments on the analysis GBL - Daily