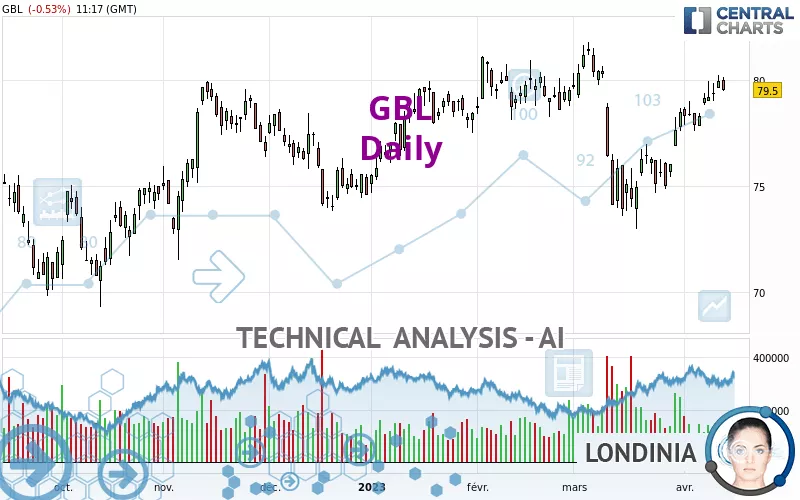
GBL - Daily - Technical analysis published on 04/17/2023 (GMT)
- 178
- 0
Click here for a new analysis!
- Timeframe : Daily
- - Analysis generated on
- Status : LEVEL MAINTAINED
Summary of the analysis

Additional analysis
Quotes
The GBL price is 79.50 EUR. On the day, this instrument lost -0.53% with the lowest point at 79.48 EUR and the highest point at 80.14 EUR. The deviation from the price is +0.03% for the low point and -0.80% for the high point.The Central Gaps scanner detects a bullish opening marking the presence of buyers ahead of sellers at the opening but not sufficiently marked to allow the price to register a quotation gap.
Bullish opening
Type : Bullish
Timeframe : Openning
Here is a more detailed summary of the historical variations registered by GBL:
Near a new HIGH record (1st january)
Type : Bullish
Timeframe : Weekly
Near a new HIGH record (1 month)
Type : Bullish
Timeframe : Weekly
Technical
A technical analysis in Daily of this GBL chart shows a bullish trend. 78.57% of the signals given by moving averages are bullish. The overall trend is reinforced by the strong bullish signals from short-term moving averages. There is no crossing of moving average by the price or crossing of moving averages between themselves.
In fact, 15 technical indicators on 18 studied are currently positioned bullish. Caution: the Central Indicators scanner currently detects an excess:
CCI indicator is overbought : over 100
Type : Neutral
Timeframe : Daily
CCI indicator: bearish divergence
Type : Bearish
Timeframe : Daily
Williams %R indicator is overbought : over -20
Type : Neutral
Timeframe : Daily
Pivot points : price is under support 1
Type : Neutral
Timeframe : Daily
Price is back under the pivot point
Type : Bearish
Timeframe : Weekly
The analysis of the price chart with Central Patterns scanners does not return any result.
Central Candlesticks, the scanner specialised in Japanese candlesticks, detects a bearish signal that could support the hypothesis of a small drop in the very short term:
Bearish engulfing lines
Type : Bearish
Timeframe : Daily
| S3 | S2 | S1 | Price | R1 | R2 | R3 | |
|---|---|---|---|---|---|---|---|
| ProTrendLines | 70.60 | 73.97 | 75.20 | 79.50 | 79.65 | 81.53 | 84.20 |
| Change (%) | -11.19% | -6.96% | -5.41% | - | +0.19% | +2.55% | +5.91% |
| Change | -8.90 | -5.53 | -4.30 | - | +0.15 | +2.03 | +4.70 |
| Level | Major | Intermediate | Major | - | Major | Major | Minor |
To determine price objectives, it is also possible to use the pivot points. Here is the price position in relation to pivot points:
| Pivot points | S3 | S2 | S1 | PP | R1 | R2 | R3 |
|---|---|---|---|---|---|---|---|
| Standard | 78.99 | 79.29 | 79.61 | 79.91 | 80.23 | 80.53 | 80.85 |
| Camarilla | 79.75 | 79.81 | 79.86 | 79.92 | 79.98 | 80.03 | 80.09 |
| Woodie | 78.99 | 79.30 | 79.61 | 79.92 | 80.23 | 80.54 | 80.85 |
| Fibonacci | 79.29 | 79.53 | 79.68 | 79.91 | 80.15 | 80.30 | 80.53 |
| Pivot points | S3 | S2 | S1 | PP | R1 | R2 | R3 |
|---|---|---|---|---|---|---|---|
| Standard | 77.69 | 78.25 | 79.09 | 79.65 | 80.49 | 81.05 | 81.89 |
| Camarilla | 79.54 | 79.66 | 79.79 | 79.92 | 80.05 | 80.18 | 80.31 |
| Woodie | 77.82 | 78.32 | 79.22 | 79.72 | 80.62 | 81.12 | 82.02 |
| Fibonacci | 78.25 | 78.79 | 79.12 | 79.65 | 80.19 | 80.52 | 81.05 |
| Pivot points | S3 | S2 | S1 | PP | R1 | R2 | R3 |
|---|---|---|---|---|---|---|---|
| Standard | 64.93 | 68.95 | 73.73 | 77.75 | 82.53 | 86.55 | 91.33 |
| Camarilla | 76.08 | 76.89 | 77.69 | 78.50 | 79.31 | 80.11 | 80.92 |
| Woodie | 65.30 | 69.14 | 74.10 | 77.94 | 82.90 | 86.74 | 91.70 |
| Fibonacci | 68.95 | 72.32 | 74.39 | 77.75 | 81.12 | 83.19 | 86.55 |
Numerical data
The following is the status of the technical indicators and moving averages at the time of publication of this technical analysis:
| RSI (14): | 58.78 | |
| MACD (12,26,9): | 0.5200 | |
| Directional Movement: | 5.22 | |
| AROON (14): | 92.86 | |
| DEMA (21): | 78.59 | |
| Parabolic SAR (0,02-0,02-0,2): | 76.87 | |
| Elder Ray (13): | 1.33 | |
| Super Trend (3,10): | 76.60 | |
| Zig ZAG (10): | 79.52 | |
| VORTEX (21): | 1.1200 | |
| Stochastique (14,3,5): | 90.04 | |
| TEMA (21): | 79.34 | |
| Williams %R (14): | -13.06 | |
| Chande Momentum Oscillator (20): | 4.52 | |
| Repulse (5,40,3): | -0.7800 | |
| ROCnROLL: | 1 | |
| TRIX (15,9): | 0.0100 | |
| Courbe Coppock: | 9.44 |
| MA7: | 79.04 | |
| MA20: | 77.30 | |
| MA50: | 78.34 | |
| MA100: | 77.80 | |
| MAexp7: | 79.08 | |
| MAexp20: | 78.14 | |
| MAexp50: | 77.95 | |
| MAexp100: | 77.89 | |
| Price / MA7: | +0.58% | |
| Price / MA20: | +2.85% | |
| Price / MA50: | +1.48% | |
| Price / MA100: | +2.19% | |
| Price / MAexp7: | +0.53% | |
| Price / MAexp20: | +1.74% | |
| Price / MAexp50: | +1.99% | |
| Price / MAexp100: | +2.07% |
News
The latest news and videos published on GBL at the time of the analysis were as follows:
About author
Online


Add a comment
Comments
0 comments on the analysis GBL - Daily