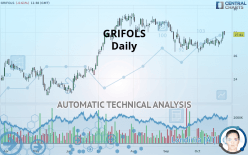
GRIFOLS - Daily - Technical analysis published on 10/25/2019 (GMT)
- 287
- 0
- Who voted?
Click here for a new analysis!
- Timeframe : Daily
- - Analysis generated on
- Status : TARGET REACHED

Summary of the analysis

Additional analysis
Quotes
The GRIFOLS rating is 27.81 EUR. The price is lower by -0.61% since the last closing and was between 27.73 EUR and 28.11 EUR. This implies that the price is at +0.29% from its lowest and at -1.07% from its highest.A bullish gap was detected at the opening by the Central Gaps scanner. There are a lot of buyers and they have the upper hand in the very short term.
Opening Gap UP
Type : Bullish
Timeframe : Openning
Here is a more detailed summary of the historical variations registered by GRIFOLS:
Technical
A technical analysis in Daily of this GRIFOLS chart shows a bullish trend. 75% of the signals given by moving averages are bullish. The overall trend is reinforced by the strong bullish signals from short-term moving averages. The Central Indicators scanner detects bullish signals on moving averages that could impact this trend:
Bullish trend reversal : adaptative moving average 50
Type : Bullish
Timeframe : Daily
Bullish price crossover with Moving Average 50
Type : Bullish
Timeframe : Daily
Bullish price crossover with Moving Average 100
Type : Bullish
Timeframe : Daily
Bullish price crossover with adaptative moving average 20
Type : Bullish
Timeframe : Daily
Bullish price crossover with adaptative moving average 50
Type : Bullish
Timeframe : Daily
Bullish price crossover with adaptative moving average 100
Type : Bullish
Timeframe : Daily
In fact, 17 technical indicators on 18 studied are currently bullish. But beware of excesses. The Central Indicators scanner currently detects this:
CCI indicator is overbought : over 100
Type : Neutral
Timeframe : Daily
Williams %R indicator is overbought : over -20
Type : Neutral
Timeframe : Daily
Pivot points : price is over resistance 1
Type : Neutral
Timeframe : Weekly
MACD indicator is back over 0
Type : Bullish
Timeframe : Daily
Price is back over the pivot point
Type : Bullish
Timeframe : Daily
Central Patterns, the market scanner focusing on chart patterns, resistances and supports found these results:
Near horizontal resistance
Type : Bearish
Timeframe : Daily
Resistance of channel is broken
Type : Bullish
Timeframe : Daily
The Central Candlesticks scanner, specialised in Japanese candlesticks, did not identify any signals.
| S3 | S2 | S1 | Price | R1 | R2 | |
|---|---|---|---|---|---|---|
| ProTrendLines | 23.88 | 25.54 | 26.95 | 27.81 | 28.06 | 29.58 |
| Change (%) | -14.13% | -8.16% | -3.09% | - | +0.90% | +6.36% |
| Change | -3.93 | -2.27 | -0.86 | - | +0.25 | +1.77 |
| Level | Intermediate | Minor | Major | - | Major | Major |
Attention could also be paid to pivot points to set price objectives:
| Pivot points | S3 | S2 | S1 | PP | R1 | R2 | R3 |
|---|---|---|---|---|---|---|---|
| Standard | 26.65 | 26.95 | 27.47 | 27.77 | 28.29 | 28.59 | 29.11 |
| Camarilla | 27.76 | 27.83 | 27.91 | 27.98 | 28.06 | 28.13 | 28.21 |
| Woodie | 26.75 | 27.01 | 27.57 | 27.83 | 28.39 | 28.65 | 29.21 |
| Fibonacci | 26.95 | 27.27 | 27.46 | 27.77 | 28.09 | 28.28 | 28.59 |
| Pivot points | S3 | S2 | S1 | PP | R1 | R2 | R3 |
|---|---|---|---|---|---|---|---|
| Standard | 26.13 | 26.49 | 26.89 | 27.25 | 27.65 | 28.01 | 28.41 |
| Camarilla | 27.07 | 27.14 | 27.21 | 27.28 | 27.35 | 27.42 | 27.49 |
| Woodie | 26.14 | 26.50 | 26.90 | 27.26 | 27.66 | 28.02 | 28.42 |
| Fibonacci | 26.49 | 26.78 | 26.96 | 27.25 | 27.54 | 27.72 | 28.01 |
| Pivot points | S3 | S2 | S1 | PP | R1 | R2 | R3 |
|---|---|---|---|---|---|---|---|
| Standard | 23.16 | 24.74 | 25.89 | 27.47 | 28.62 | 30.20 | 31.35 |
| Camarilla | 26.29 | 26.54 | 26.79 | 27.04 | 27.29 | 27.54 | 27.79 |
| Woodie | 22.95 | 24.63 | 25.68 | 27.36 | 28.41 | 30.09 | 31.14 |
| Fibonacci | 24.74 | 25.78 | 26.43 | 27.47 | 28.51 | 29.16 | 30.20 |
Numerical data
The following is the status of the technical indicators and moving averages at the time of publication of this technical analysis:
| RSI (14): | 58.30 | |
| MACD (12,26,9): | 0.0500 | |
| Directional Movement: | 13.09 | |
| AROON (14): | 100.00 | |
| DEMA (21): | 27.28 | |
| Parabolic SAR (0,02-0,02-0,2): | 26.72 | |
| Elder Ray (13): | 0.59 | |
| Super Trend (3,10): | 28.05 | |
| Zig ZAG (10): | 27.81 | |
| VORTEX (21): | 1.0900 | |
| Stochastique (14,3,5): | 80.01 | |
| TEMA (21): | 27.50 | |
| Williams %R (14): | -21.74 | |
| Chande Momentum Oscillator (20): | 0.43 | |
| Repulse (5,40,3): | 0.9000 | |
| ROCnROLL: | 1 | |
| TRIX (15,9): | -0.0500 | |
| Courbe Coppock: | 4.21 |
| MA7: | 27.41 | |
| MA20: | 27.10 | |
| MA50: | 27.59 | |
| MA100: | 27.42 | |
| MAexp7: | 27.48 | |
| MAexp20: | 27.28 | |
| MAexp50: | 27.36 | |
| MAexp100: | 27.00 | |
| Price / MA7: | +1.46% | |
| Price / MA20: | +2.62% | |
| Price / MA50: | +0.80% | |
| Price / MA100: | +1.42% | |
| Price / MAexp7: | +1.20% | |
| Price / MAexp20: | +1.94% | |
| Price / MAexp50: | +1.64% | |
| Price / MAexp100: | +3.00% |
News
The last news published on GRIFOLS at the time of the generation of this analysis was as follows:
- Grifols presents additional encouraging Alzheimer's trial results at AAIC
- Grifols Announces FDA Approval of Xembify®, 20% Subcutaneous Immunoglobulin for Primary Immunodeficiencies
- Grifols Selected to Build Its First Intravenous Solutions Manufacturing Line in Africa
- Grifols to launch plasma-protein-based bleeding-control solutions
- Grifols Announces PharmacyKeeper Bidirectional Integration with Epic
About author

Online


Add a comment
Comments
0 comments on the analysis GRIFOLS - Daily