| Open: | 2,311.62 |
| Change: | +4.96 |
| Volume: | 0 |
| Low: | 2,307.63 |
| High: | 2,315.45 |
| High / Low range: | 7.82 |
| Type: | Stocks |
| Ticker: | GRF |
| ISIN: | ES0171996087 |
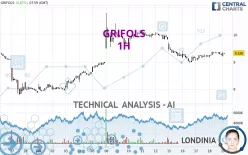
GRIFOLS - 1H - Technical analysis published on 07/19/2024 (GMT)
- 139
- 0
- 07/19/2024 - 08:15
- Timeframe : 1H
- - Analysis generated on 07/19/2024 - 08:15
- Status : NEUTRAL

Summary of the analysis

Additional analysis
Quotes
The GRIFOLS rating is 9.318 EUR. The price registered an increase of +0.78% on the session and was traded between 9.186 EUR and 9.384 EUR over the period. The price is currently at +1.44% from its lowest and -0.70% from its highest.The Central Gaps scanner detects a bearish opening marking the presence of sellers ahead of buyers at the opening but not sufficiently marked to allow the price to register a quotation gap.
Bearish opening
Type : Bearish
Timeframe : Openning
A study of price movements over other periods shows the following variations:
Technical
A technical analysis in 1H of this GRIFOLS chart shows a slightly bearish trend. 53.57% of the signals given by moving averages are bullish. As the signals currently given by short-term moving averages are rather neutral, the overall trend could quickly return to neutral as well. An assessment of moving averages reveals several bearish and bullish signals:
Bearish trend reversal : adaptative moving average 20
Type : Bearish
Timeframe : 1 hour
Bullish price crossover with adaptative moving average 100
Type : Bullish
Timeframe : 1 hour
In fact, 10 technical indicators on 18 studied are currently positioned bullish. Caution: the Central Indicators scanner currently detects an excess:
Williams %R indicator is overbought : over -20
Type : Neutral
Timeframe : 1 hour
RSI indicator is back over 50
Type : Bullish
Timeframe : 1 hour
Parabolic SAR indicator bearish reversal
Type : Bearish
Timeframe : 1 hour
Price is back over the pivot point
Type : Bullish
Timeframe : 1 hour
An analysis of the price chart with the Central Patterns scanner (detector of chart patterns and resistances and supports) shows a result that can have an impact on the price change:
Near resistance of channel
Type : Bearish
Timeframe : 1 hour
The Central Candlesticks scanner, specialised in Japanese candlesticks, did not identify any signals.
| S3 | S2 | S1 | Price | R1 | R2 | R3 | |
|---|---|---|---|---|---|---|---|
| ProTrendLines | 8.030 | 8.477 | 8.952 | 9.318 | 9.377 | 10.105 | 10.805 |
| Change (%) | -13.82% | -9.03% | -3.93% | - | +0.63% | +8.45% | +15.96% |
| Change | -1.288 | -0.841 | -0.366 | - | +0.059 | +0.787 | +1.487 |
| Level | Major | Minor | Intermediate | - | Major | Major | Intermediate |
Attention could also be paid to pivot points to set price objectives:
| Pivot points | S3 | S2 | S1 | PP | R1 | R2 | R3 |
|---|---|---|---|---|---|---|---|
| Standard | 8.918 | 9.038 | 9.142 | 9.262 | 9.366 | 9.486 | 9.590 |
| Camarilla | 9.184 | 9.205 | 9.226 | 9.246 | 9.267 | 9.287 | 9.308 |
| Woodie | 8.910 | 9.034 | 9.134 | 9.258 | 9.358 | 9.482 | 9.582 |
| Fibonacci | 9.038 | 9.124 | 9.176 | 9.262 | 9.348 | 9.400 | 9.486 |
| Pivot points | S3 | S2 | S1 | PP | R1 | R2 | R3 |
|---|---|---|---|---|---|---|---|
| Standard | 7.983 | 8.741 | 9.288 | 10.046 | 10.593 | 11.351 | 11.898 |
| Camarilla | 9.475 | 9.595 | 9.714 | 9.834 | 9.954 | 10.073 | 10.193 |
| Woodie | 7.877 | 8.688 | 9.182 | 9.993 | 10.487 | 11.298 | 11.792 |
| Fibonacci | 8.741 | 9.240 | 9.548 | 10.046 | 10.545 | 10.853 | 11.351 |
| Pivot points | S3 | S2 | S1 | PP | R1 | R2 | R3 |
|---|---|---|---|---|---|---|---|
| Standard | 5.243 | 6.507 | 7.183 | 8.447 | 9.123 | 10.387 | 11.063 |
| Camarilla | 7.327 | 7.504 | 7.682 | 7.860 | 8.038 | 8.216 | 8.394 |
| Woodie | 4.950 | 6.360 | 6.890 | 8.300 | 8.830 | 10.240 | 10.770 |
| Fibonacci | 6.507 | 7.248 | 7.706 | 8.447 | 9.188 | 9.646 | 10.387 |
Numerical data
The following are the details of the technical indicators and moving averages that were collected to generate this technical analysis:
| RSI (14): | 47.23 | |
| MACD (12,26,9): | -0.0140 | |
| Directional Movement: | 0.889 | |
| AROON (14): | 100.000 | |
| DEMA (21): | 9.247 | |
| Parabolic SAR (0,02-0,02-0,2): | 9.382 | |
| Elder Ray (13): | 0.001 | |
| Super Trend (3,10): | 9.371 | |
| Zig ZAG (10): | 9.292 | |
| VORTEX (21): | 1.0890 | |
| Stochastique (14,3,5): | 54.84 | |
| TEMA (21): | 9.314 | |
| Williams %R (14): | -38.05 | |
| Chande Momentum Oscillator (20): | 0.072 | |
| Repulse (5,40,3): | 0.1050 | |
| ROCnROLL: | -1 | |
| TRIX (15,9): | -0.0540 | |
| Courbe Coppock: | 2.81 |
| MA7: | 9.424 | |
| MA20: | 9.054 | |
| MA50: | 9.254 | |
| MA100: | 8.879 | |
| MAexp7: | 9.298 | |
| MAexp20: | 9.281 | |
| MAexp50: | 9.350 | |
| MAexp100: | 9.305 | |
| Price / MA7: | -1.12% | |
| Price / MA20: | +2.92% | |
| Price / MA50: | +0.69% | |
| Price / MA100: | +4.94% | |
| Price / MAexp7: | +0.22% | |
| Price / MAexp20: | +0.40% | |
| Price / MAexp50: | -0.34% | |
| Price / MAexp100: | +0.14% |
News
The last news published on GRIFOLS at the time of the generation of this analysis was as follows:
- 07/01/2024 - 10:00 Grifols’ Biotest to achieve USD 1 billion in US sales of Yimmugo® over next seven years
- 06/18/2024 - 11:30 Grifols completes sale of a 20% equity stake in SRAAS and forges strategic alliance with Haier Group
- 06/17/2024 - 08:20 Grifols’ Biotest receives FDA approval for innovative Yimmugo® immunoglobulin to treat primary immunodeficiencies
- 06/02/2024 - 11:00 INVESTIGATION PROGRESS UPDATE: The Schall Law Firm Announces it is Investigating Claims Against Grifols, S.A. and Encourages Investors with Losses to Contact the Firm
- 06/01/2024 - 11:00 INVESTIGATION PROGRESS REMINDER: The Schall Law Firm Announces it is Investigating Claims Against Grifols, S.A. and Encourages Investors with Losses to Contact the Firm
About author
Online


Add a comment
Comments
0 comments on the analysis GRIFOLS - 1H