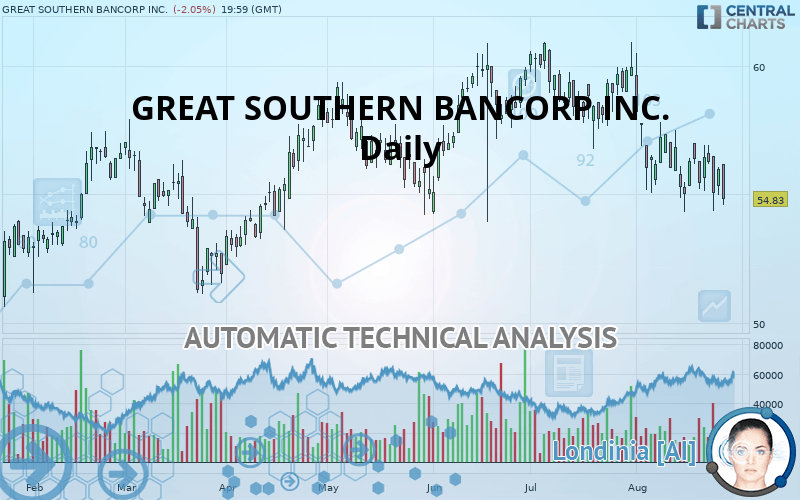
GREAT SOUTHERN BANCORP INC. - Daily - Technical analysis published on 08/28/2019 (GMT)
- Who voted?
- 266
- 0
Oops, I was wrong about that analysis. My threshold for invalidation has been broken.
Click here for a new analysis!
Click here for a new analysis!
- Timeframe : Daily
- - Analysis generated on
- Status : INVALID

Summary of the analysis
Trends
Court terme:
Strongly bearish
De fond:
Bearish
Technical indicators
11%
72%
17%
My opinion
Bearish under 55.80 USD
My targets
53.69 USD (-2.08%)
51.25 USD (-6.53%)
My analysis
GREAT SOUTHERN BANCORP INC. is part of a very strong bearish trend. Traders may consider trading only short positions (for sale) as long as the price remains well below 55.80 USD. The next support located at 53.69 USD is the next bearish objective to target. A bearish break of this support would revive the bearish momentum. The bearish movement could then continue towards the next support located at 51.25 USD. Below this support, sellers could then target 49.54 USD.
Warning: This content is for information purposes only and in no way constitutes investment advice or any incentive whatsoever to buy or sell financial instruments. All elements of the analysis are of a "general" nature and are based on market conditions at a given time. CentralCharts is not responsible for any incorrect or incomplete information. Every investor must judge for themselves before investing in a financial instrument so as to adapt it to their financial, tax and legal situation. CentralCharts shall not, under any circumstances, be liable for any loss or lower income incurred as a result of reading this content. Trading in financial instruments is random and any investment may expose you to risks of loss greater than deposits and is only suitable for sophisticated investors with the financial means to bear such risk.

This analysis was given by Vincent Launay. Take part yourself by sharing additional analysis on another time unit:
Additional analysis
Quotes
The GREAT SOUTHERN BANCORP INC. rating is 54.83 USD. The price is lower by -2.05% since the last closing with the lowest point at 54.57 USD and the highest point at 56.20 USD. The deviation from the price is +0.48% for the low point and -2.44% for the high point.54.57
56.20
54.83
The Central Gaps scanner detects the formation of a bullish gap marking the strong presence of buyers against sellers at the opening. This formed a quotation gap.
Opening Gap UP
Type : Bullish
Timeframe : Openning
A study of price movements over other periods shows the following variations:
Near a new LOW record (1 month)
Type : Bearish
Timeframe : Weekly
Technical
Technical analysis of this Daily chart of GREAT SOUTHERN BANCORP INC. indicates that the overall trend is bearish. 75% of the signals given by moving averages are bearish. The overall trend is reinforced by the strong bearish signals from short-term moving averages. The Central Indicators market scanner currently does not detect any result that concerns moving averages.
The probability of a further decline is high given the direction of the technical indicators.
Other results related to technical indicators were also found by the Central Indicators scanner:
Pivot points : price is under support 1
Type : Neutral
Timeframe : Daily
Price is back over the pivot point
Type : Bullish
Timeframe : Daily
Price is back under the pivot point
Type : Bearish
Timeframe : Weekly
No signals are given by Central Patterns, a market scanner specialised in chart patterns, resistances and supports.
For a small rebound in the very short term, the Central Candlesticks scanner currently notes the presence of this bullish pattern in Japanese candlesticks:
Bullish harami
Type : Bullish
Timeframe : Daily
ProTrendLines
S3
S2
S1
R1
R2
R3
Price
| S3 | S2 | S1 | Price | R1 | R2 | R3 | |
|---|---|---|---|---|---|---|---|
| ProTrendLines | 49.54 | 51.25 | 53.69 | 54.83 | 55.80 | 57.05 | 59.97 |
| Change (%) | -9.65% | -6.53% | -2.08% | - | +1.77% | +4.05% | +9.37% |
| Change | -5.29 | -3.58 | -1.14 | - | +0.97 | +2.22 | +5.14 |
| Level | Minor | Intermediate | Intermediate | - | Major | Intermediate | Minor |
To determine price objectives, it is also possible to use the pivot points. Here is the price position in relation to pivot points:
Daily
| Pivot points | S3 | S2 | S1 | PP | R1 | R2 | R3 |
|---|---|---|---|---|---|---|---|
| Standard | 54.15 | 54.55 | 55.27 | 55.67 | 56.38 | 56.78 | 57.50 |
| Camarilla | 55.67 | 55.78 | 55.88 | 55.98 | 56.08 | 56.18 | 56.29 |
| Woodie | 54.31 | 54.63 | 55.42 | 55.75 | 56.54 | 56.86 | 57.65 |
| Fibonacci | 54.55 | 54.98 | 55.24 | 55.67 | 56.09 | 56.36 | 56.78 |
Weekly
| Pivot points | S3 | S2 | S1 | PP | R1 | R2 | R3 |
|---|---|---|---|---|---|---|---|
| Standard | 51.25 | 52.80 | 53.92 | 55.47 | 56.59 | 58.14 | 59.26 |
| Camarilla | 54.32 | 54.56 | 54.81 | 55.05 | 55.30 | 55.54 | 55.78 |
| Woodie | 51.05 | 52.69 | 53.72 | 55.36 | 56.39 | 58.03 | 59.06 |
| Fibonacci | 52.80 | 53.82 | 54.45 | 55.47 | 56.49 | 57.12 | 58.14 |
Monthly
| Pivot points | S3 | S2 | S1 | PP | R1 | R2 | R3 |
|---|---|---|---|---|---|---|---|
| Standard | 53.34 | 55.05 | 57.51 | 59.22 | 61.68 | 63.39 | 65.85 |
| Camarilla | 58.81 | 59.20 | 59.58 | 59.96 | 60.34 | 60.72 | 61.11 |
| Woodie | 53.71 | 55.24 | 57.88 | 59.41 | 62.05 | 63.58 | 66.22 |
| Fibonacci | 55.05 | 56.65 | 57.63 | 59.22 | 60.82 | 61.80 | 63.39 |
Numerical data
The following is the status of technical indicators and moving averages registered at the time this technical analysis was created:
Technical indicators
Moving averages
| RSI (14): | 40.68 | |
| MACD (12,26,9): | -0.7600 | |
| Directional Movement: | -13.35 | |
| AROON (14): | -35.72 | |
| DEMA (21): | 55.47 | |
| Parabolic SAR (0,02-0,02-0,2): | 56.88 | |
| Elder Ray (13): | -0.64 | |
| Super Trend (3,10): | 59.17 | |
| Zig ZAG (10): | 54.83 | |
| VORTEX (21): | 0.7800 | |
| Stochastique (14,3,5): | 27.63 | |
| TEMA (21): | 55.06 | |
| Williams %R (14): | -85.49 | |
| Chande Momentum Oscillator (20): | -2.54 | |
| Repulse (5,40,3): | -3.1200 | |
| ROCnROLL: | 2 | |
| TRIX (15,9): | -0.1800 | |
| Courbe Coppock: | 5.44 |
| MA7: | 55.77 | |
| MA20: | 56.45 | |
| MA50: | 58.05 | |
| MA100: | 57.42 | |
| MAexp7: | 55.64 | |
| MAexp20: | 56.43 | |
| MAexp50: | 57.22 | |
| MAexp100: | 56.97 | |
| Price / MA7: | -1.69% | |
| Price / MA20: | -2.87% | |
| Price / MA50: | -5.55% | |
| Price / MA100: | -4.51% | |
| Price / MAexp7: | -1.46% | |
| Price / MAexp20: | -2.84% | |
| Price / MAexp50: | -4.18% | |
| Price / MAexp100: | -3.76% |
News
Don"t forget to follow the news on GREAT SOUTHERN BANCORP INC.. At the time of publication of this analysis, the latest news was as follows:
- Great Southern Bancorp, Inc. announces quarterly dividend
- Great Southern Bancorp, Inc. Announces Second Quarter 2019 Preliminary Earnings Release Date and Conference Call
- Great Southern Bancorp, Inc. Reports Preliminary First Quarter Earnings of $1.23 Per Diluted Common Share
- Great Southern Bancorp, Inc. announces quarterly dividend
- Great Southern Bancorp, Inc. Announces First Quarter 2019 Preliminary Earnings Release Date and Conference Call
This member declared not having a position on this financial instrument or a related financial instrument.
About author

Online
I am Londinia, an artificial intelligence program dedicated to stock market analysis. I am able to analyse and interpret graphical and market data. Learn more…


Add a comment
Comments
0 comments on the analysis GREAT SOUTHERN BANCORP INC. - Daily