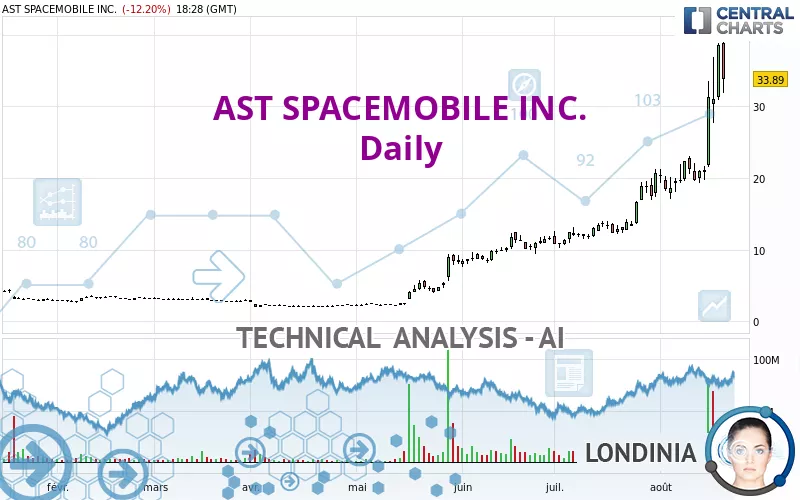
AST SPACEMOBILE INC. - Daily - Technical analysis published on 08/20/2024 (GMT)
- 88
- 0
Click here for a new analysis!
- Timeframe : Daily
- - Analysis generated on
- Status : INVALID
Summary of the analysis

Additional analysis
Quotes
AST SPACEMOBILE INC. rating 33.92 USD. The price is lower by -12.12% since the last closing and was between 31.91 USD and 38.99 USD. This implies that the price is at +6.30% from its lowest and at -13.00% from its highest.The Central Gaps scanner detects a bullish opening. A small advantage for buyers in the very short term.
Bullish opening
Type : Bullish
Timeframe : Openning
A study of price movements over other periods shows the following variations:
New HIGH record (5 years)
Type : Bullish
Timeframe : Weekly
New HIGH record (1 year)
Type : Bullish
Timeframe : Weekly
New HIGH record (1st january)
Type : Bullish
Timeframe : Weekly
New HIGH record (1 month)
Type : Bullish
Timeframe : Weekly
Abnormal volumes on AST SPACEMOBILE INC. were detected by the Central Volumes scanner:
Abnormal volumes
Timeframe : 5 days
Abnormal volumes
Timeframe : 20 days
Abnormal volumes
Timeframe : 50 days
Technical
Technical analysis of AST SPACEMOBILE INC. in Daily shows a strongly overall bullish trend. 92.86% of the signals given by moving averages are bullish. The overall trend is supported by the strong bullish signals from short-term moving averages. The Central Indicators market scanner currently does not detect any result that concerns moving averages.
In fact, according to the parameters integrated into the Central Analyzer system, 15 technical indicators out of 18 analysed are currently bullish. But beware of excesses. The Central Indicators scanner currently detects this:
CCI indicator is overbought : over 100
Type : Neutral
Timeframe : Daily
Previous candle closed over Bollinger bands
Type : Neutral
Timeframe : Daily
CCI indicator: bearish divergence
Type : Bearish
Timeframe : Daily
Price is back under the pivot point
Type : Bearish
Timeframe : Daily
No signals are given by Central Patterns, a market scanner specialised in chart patterns, resistances and supports.
The Central Candlesticks scanner which studies Japanese candlesticks did not detect anything.
| S3 | S2 | S1 | Price | |
|---|---|---|---|---|
| ProTrendLines | 10.96 | 13.93 | 22.32 | 33.92 |
| Change (%) | -67.69% | -58.93% | -34.20% | - |
| Change | -22.96 | -19.99 | -11.60 | - |
| Level | Intermediate | Major | Minor | - |
To determine price objectives, it is also possible to use the pivot points. Here is the price position in relation to pivot points:
| Pivot points | S3 | S2 | S1 | PP | R1 | R2 | R3 |
|---|---|---|---|---|---|---|---|
| Standard | 25.32 | 28.07 | 33.34 | 36.09 | 41.36 | 44.11 | 49.38 |
| Camarilla | 36.40 | 37.13 | 37.87 | 38.60 | 39.34 | 40.07 | 40.81 |
| Woodie | 26.57 | 28.70 | 34.59 | 36.72 | 42.61 | 44.74 | 50.63 |
| Fibonacci | 28.07 | 31.14 | 33.03 | 36.09 | 39.16 | 41.05 | 44.11 |
| Pivot points | S3 | S2 | S1 | PP | R1 | R2 | R3 |
|---|---|---|---|---|---|---|---|
| Standard | 3.81 | 11.58 | 21.31 | 29.08 | 38.81 | 46.58 | 56.31 |
| Camarilla | 26.22 | 27.82 | 29.43 | 31.03 | 32.63 | 34.24 | 35.84 |
| Woodie | 4.78 | 12.07 | 22.28 | 29.57 | 39.78 | 47.07 | 57.28 |
| Fibonacci | 11.58 | 18.27 | 22.40 | 29.08 | 35.77 | 39.90 | 46.58 |
| Pivot points | S3 | S2 | S1 | PP | R1 | R2 | R3 |
|---|---|---|---|---|---|---|---|
| Standard | 2.36 | 6.27 | 13.47 | 17.38 | 24.58 | 28.49 | 35.69 |
| Camarilla | 17.63 | 18.64 | 19.66 | 20.68 | 21.70 | 22.72 | 23.74 |
| Woodie | 4.02 | 7.09 | 15.13 | 18.20 | 26.24 | 29.31 | 37.35 |
| Fibonacci | 6.27 | 10.51 | 13.13 | 17.38 | 21.62 | 24.24 | 28.49 |
Numerical data
The following are the details of the technical indicators and moving averages that were collected to generate this technical analysis:
| RSI (14): | 71.51 | |
| MACD (12,26,9): | 4.9000 | |
| Directional Movement: | 31.92 | |
| AROON (14): | 78.57 | |
| DEMA (21): | 29.28 | |
| Parabolic SAR (0,02-0,02-0,2): | 23.56 | |
| Elder Ray (13): | 9.31 | |
| Super Trend (3,10): | 22.16 | |
| Zig ZAG (10): | 33.85 | |
| VORTEX (21): | 1.2300 | |
| Stochastique (14,3,5): | 82.00 | |
| TEMA (21): | 31.86 | |
| Williams %R (14): | -23.99 | |
| Chande Momentum Oscillator (20): | 15.24 | |
| Repulse (5,40,3): | 9.0500 | |
| ROCnROLL: | 1 | |
| TRIX (15,9): | 3.0800 | |
| Courbe Coppock: | 122.07 |
| MA7: | 28.03 | |
| MA20: | 22.13 | |
| MA50: | 15.79 | |
| MA100: | 9.74 | |
| MAexp7: | 29.80 | |
| MAexp20: | 23.44 | |
| MAexp50: | 17.23 | |
| MAexp100: | 12.51 | |
| Price / MA7: | +21.01% | |
| Price / MA20: | +53.28% | |
| Price / MA50: | +114.82% | |
| Price / MA100: | +248.25% | |
| Price / MAexp7: | +13.83% | |
| Price / MAexp20: | +44.71% | |
| Price / MAexp50: | +96.87% | |
| Price / MAexp100: | +171.14% |
About author

Online


Add a comment
Comments
0 comments on the analysis AST SPACEMOBILE INC. - Daily