AXON ENTERPRISE INC. - Weekly - Technical analysis published on 08/08/2024 (GMT)
- 127
- 0
Click here for a new analysis!
- Timeframe : Weekly
- - Analysis generated on
- Status : TARGET REACHED

Summary of the analysis

Additional analysis
Quotes
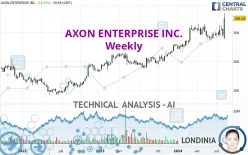
The AXON ENTERPRISE INC. price is 349.24 USD. Over 5 days, this instrument gained +16.56% and has been traded over the last 5 days between 279.02 USD and 367.95 USD. This implies that the 5 day price is +25.17% from its lowest point and -5.08% from its highest point.The Central Gaps scanner detects a bullish gap which is a sign that buyers have taken the lead in the very short term.
Opening Gap UP
Type : Bullish
Timeframe : Openning
A study of price movements over other periods shows the following variations:
New HIGH record (5 years)
Type : Bullish
Timeframe : Weekly
New HIGH record (1 year)
Type : Bullish
Timeframe : Weekly
New HIGH record (1st january)
Type : Bullish
Timeframe : Weekly
New HIGH record (1 month)
Type : Bullish
Timeframe : Weekly
The Central Volumes scanner detects abnormal volumes on the asset:
Abnormal volumes
Timeframe : 5 days
Technical
Technical analysis of this Weekly chart of AXON ENTERPRISE INC. indicates that the overall trend is strongly bullish. 92.86% of the signals given by moving averages are bullish. The overall trend is supported by the strong bullish signals from short-term moving averages. The Central Indicators market scanner is currently detecting several bullish signals that could impact this trend:
Bullish price crossover with Moving Average 20
Type : Bullish
Timeframe : Weekly
Bullish price crossover with adaptative moving average 20
Type : Bullish
Timeframe : Weekly
In fact, according to the parameters integrated into the Central Analyzer system, 13 technical indicators out of 18 analysed are currently bullish. Caution: the Central Indicators scanner currently detects an excess:
CCI indicator is overbought : over 100
Type : Neutral
Timeframe : Weekly
Williams %R indicator is overbought : over -20
Type : Neutral
Timeframe : Weekly
Pivot points : price is over resistance 3
Type : Neutral
Timeframe : Weekly
MACD crosses UP its Moving Average
Type : Bullish
Timeframe : Weekly
Aroon indicator bullish trend
Type : Bullish
Timeframe : Weekly
Momentum indicator is back over 0
Type : Bullish
Timeframe : Weekly
An analysis of the price chart with the Central Patterns scanner (detector of chart patterns and resistances and supports) shows a result that can have an impact on the price change:
Resistance of channel is broken
Type : Bullish
Timeframe : Weekly
Central Candlesticks, the scanner specialised in Japanese candlesticks, detects these bullish signals that could support the hypothesis of a small rebound in the very short term:
Bullish engulfing lines
Type : Bullish
Timeframe : Weekly
Long white line
Type : Bullish
Timeframe : Weekly
| S3 | S2 | S1 | Price | |
|---|---|---|---|---|
| ProTrendLines | 203.51 | 276.22 | 326.93 | 349.24 |
| Change (%) | -41.73% | -20.91% | -6.39% | - |
| Change | -145.73 | -73.02 | -22.31 | - |
| Level | Major | Major | Major | - |
Pivot points can also be used to set your price objectives. Here is the price situation in relation to pivot points:
| Pivot points | S3 | S2 | S1 | PP | R1 | R2 | R3 |
|---|---|---|---|---|---|---|---|
| Standard | 282.04 | 302.97 | 326.10 | 347.03 | 370.16 | 391.09 | 414.22 |
| Camarilla | 337.12 | 341.16 | 345.20 | 349.24 | 353.28 | 357.32 | 361.36 |
| Woodie | 283.15 | 303.52 | 327.21 | 347.58 | 371.27 | 391.64 | 415.33 |
| Fibonacci | 302.97 | 319.80 | 330.20 | 347.03 | 363.86 | 374.26 | 391.09 |
| Pivot points | S3 | S2 | S1 | PP | R1 | R2 | R3 |
|---|---|---|---|---|---|---|---|
| Standard | 254.33 | 270.73 | 281.55 | 297.95 | 308.77 | 325.17 | 335.99 |
| Camarilla | 284.88 | 287.37 | 289.87 | 292.36 | 294.86 | 297.35 | 299.85 |
| Woodie | 251.53 | 269.34 | 278.75 | 296.56 | 305.97 | 323.78 | 333.19 |
| Fibonacci | 270.73 | 281.13 | 287.56 | 297.95 | 308.35 | 314.78 | 325.17 |
| Pivot points | S3 | S2 | S1 | PP | R1 | R2 | R3 |
|---|---|---|---|---|---|---|---|
| Standard | 242.43 | 264.47 | 282.24 | 304.28 | 322.05 | 344.09 | 361.86 |
| Camarilla | 289.06 | 292.71 | 296.36 | 300.01 | 303.66 | 307.31 | 310.96 |
| Woodie | 240.30 | 263.40 | 280.11 | 303.21 | 319.92 | 343.02 | 359.73 |
| Fibonacci | 264.47 | 279.68 | 289.07 | 304.28 | 319.49 | 328.88 | 344.09 |
Numerical data
The following is the status of the technical indicators and moving averages at the time of publication of this technical analysis:
| RSI (14): | 68.87 | |
| MACD (12,26,9): | 12.0600 | |
| Directional Movement: | 23.10 | |
| AROON (14): | 64.29 | |
| DEMA (21): | 314.92 | |
| Parabolic SAR (0,02-0,02-0,2): | 276.63 | |
| Elder Ray (13): | 19.32 | |
| Super Trend (3,10): | 269.80 | |
| Zig ZAG (10): | 349.24 | |
| VORTEX (21): | 0.9400 | |
| Stochastique (14,3,5): | 60.22 | |
| TEMA (21): | 312.56 | |
| Williams %R (14): | -19.81 | |
| Chande Momentum Oscillator (20): | 60.45 | |
| Repulse (5,40,3): | 16.8000 | |
| ROCnROLL: | 1 | |
| TRIX (15,9): | 0.5700 | |
| Courbe Coppock: | 2.02 |
| MA7: | 303.87 | |
| MA20: | 307.54 | |
| MA50: | 297.09 | |
| MA100: | 301.61 | |
| MAexp7: | 311.13 | |
| MAexp20: | 298.34 | |
| MAexp50: | 271.08 | |
| MAexp100: | 235.39 | |
| Price / MA7: | +14.93% | |
| Price / MA20: | +13.56% | |
| Price / MA50: | +17.55% | |
| Price / MA100: | +15.79% | |
| Price / MAexp7: | +12.25% | |
| Price / MAexp20: | +17.06% | |
| Price / MAexp50: | +28.83% | |
| Price / MAexp100: | +48.37% |
News
The latest news and videos published on AXON ENTERPRISE INC. at the time of the analysis were as follows:
About author

Online


Add a comment
Comments
0 comments on the analysis AXON ENTERPRISE INC. - Weekly