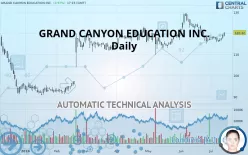
GRAND CANYON EDUCATION INC. - Daily - Technical analysis published on 07/15/2019 (GMT)
- 319
- 0
- Who voted?
Click here for a new analysis!
- Timeframe : Daily
- - Analysis generated on
- Status : TARGET REACHED

Summary of the analysis

Additional analysis
Quotes
The GRAND CANYON EDUCATION INC. price is 120.32 USD. The price registered an increase of +0.97% on the session with the lowest point at 118.56 USD and the highest point at 120.38 USD. The deviation from the price is +1.48% for the low point and -0.05% for the high point.The Central Gaps scanner detects a bullish opening marking the presence of sellers ahead of buyers at the opening but not sufficiently marked to allow the price to register a quotation gap.
Bearish opening
Type : Bearish
Timeframe : Openning
A study of price movements over other periods shows the following variations:
Technical
Technical analysis of GRAND CANYON EDUCATION INC. in Daily shows a strongly overall bullish trend. 85.71% of the signals given by moving averages are bullish. The slightly bullish signals given by the short-term moving averages indicate this trend is showing signs of running out of steam. An assessment of moving averages reveals several bullish signals that could impact this trend:
Bullish trend reversal : adaptative moving average 20
Type : Bullish
Timeframe : Daily
Bullish trend reversal : adaptative moving average 50
Type : Bullish
Timeframe : Daily
Bullish price crossover with Moving Average 20
Type : Bullish
Timeframe : Daily
Bullish price crossover with Moving Average 100
Type : Bullish
Timeframe : Daily
Bullish price crossover with adaptative moving average 20
Type : Bullish
Timeframe : Daily
In fact, 11 technical indicators on 18 studied are currently bullish. But beware of excesses. The Central Indicators scanner currently detects this:
Williams %R indicator is overbought : over -20
Type : Neutral
Timeframe : Daily
Pivot points : price is over resistance 1
Type : Neutral
Timeframe : Daily
RSI indicator is back over 50
Type : Bullish
Timeframe : Daily
Ichimoku : price is under the cloud
Type : Bearish
Timeframe : Daily
Price is back over the pivot point
Type : Bullish
Timeframe : Weekly
Momentum indicator is back over 0
Type : Bullish
Timeframe : Daily
Williams %R indicator is back over -50
Type : Bullish
Timeframe : Daily
Central Patterns, the market scanner focusing on chart patterns, resistances and supports found these results:
Near resistance of channel
Type : Bearish
Timeframe : Daily
Horizontal resistance is broken
Type : Bullish
Timeframe : Daily
No result was found by the Central Candlesticks scanner on Japanese candlesticks.
| S3 | S2 | S1 | Price | R1 | R2 | |
|---|---|---|---|---|---|---|
| ProTrendLines | 90.83 | 114.14 | 118.71 | 120.32 | 122.13 | 129.67 |
| Change (%) | -24.51% | -5.14% | -1.34% | - | +1.50% | +7.77% |
| Change | -29.49 | -6.18 | -1.61 | - | +1.81 | +9.35 |
| Level | Major | Major | Major | - | Intermediate | Major |
Attention could also be paid to pivot points to set price objectives:
| Pivot points | S3 | S2 | S1 | PP | R1 | R2 | R3 |
|---|---|---|---|---|---|---|---|
| Standard | 115.58 | 116.51 | 117.84 | 118.77 | 120.10 | 121.03 | 122.36 |
| Camarilla | 118.54 | 118.75 | 118.95 | 119.16 | 119.37 | 119.57 | 119.78 |
| Woodie | 115.77 | 116.61 | 118.03 | 118.87 | 120.29 | 121.13 | 122.55 |
| Fibonacci | 116.51 | 117.38 | 117.91 | 118.77 | 119.64 | 120.17 | 121.03 |
| Pivot points | S3 | S2 | S1 | PP | R1 | R2 | R3 |
|---|---|---|---|---|---|---|---|
| Standard | 112.91 | 114.38 | 116.77 | 118.24 | 120.63 | 122.10 | 124.49 |
| Camarilla | 118.10 | 118.45 | 118.81 | 119.16 | 119.51 | 119.87 | 120.22 |
| Woodie | 113.37 | 114.61 | 117.23 | 118.47 | 121.09 | 122.33 | 124.95 |
| Fibonacci | 114.38 | 115.86 | 116.77 | 118.24 | 119.72 | 120.63 | 122.10 |
| Pivot points | S3 | S2 | S1 | PP | R1 | R2 | R3 |
|---|---|---|---|---|---|---|---|
| Standard | 96.99 | 106.02 | 111.52 | 120.55 | 126.05 | 135.08 | 140.58 |
| Camarilla | 113.02 | 114.36 | 115.69 | 117.02 | 118.35 | 119.68 | 121.02 |
| Woodie | 95.23 | 105.14 | 109.76 | 119.67 | 124.29 | 134.20 | 138.82 |
| Fibonacci | 106.02 | 111.57 | 115.00 | 120.55 | 126.10 | 129.53 | 135.08 |
Numerical data
The following is the status of technical indicators and moving averages registered at the time this technical analysis was created:
| RSI (14): | 54.86 | |
| MACD (12,26,9): | -0.6400 | |
| Directional Movement: | 0.29 | |
| AROON (14): | -14.29 | |
| DEMA (21): | 118.02 | |
| Parabolic SAR (0,02-0,02-0,2): | 115.29 | |
| Elder Ray (13): | 1.00 | |
| Super Trend (3,10): | 122.54 | |
| Zig ZAG (10): | 120.21 | |
| VORTEX (21): | 0.8800 | |
| Stochastique (14,3,5): | 68.84 | |
| TEMA (21): | 117.27 | |
| Williams %R (14): | -2.46 | |
| Chande Momentum Oscillator (20): | 3.89 | |
| Repulse (5,40,3): | 2.7400 | |
| ROCnROLL: | 1 | |
| TRIX (15,9): | -0.1000 | |
| Courbe Coppock: | 3.91 |
| MA7: | 117.81 | |
| MA20: | 118.89 | |
| MA50: | 119.36 | |
| MA100: | 118.05 | |
| MAexp7: | 118.43 | |
| MAexp20: | 118.85 | |
| MAexp50: | 118.81 | |
| MAexp100: | 116.87 | |
| Price / MA7: | +2.13% | |
| Price / MA20: | +1.20% | |
| Price / MA50: | +0.80% | |
| Price / MA100: | +1.92% | |
| Price / MAexp7: | +1.60% | |
| Price / MAexp20: | +1.24% | |
| Price / MAexp50: | +1.27% | |
| Price / MAexp100: | +2.95% |
News
The last news published on GRAND CANYON EDUCATION INC. at the time of the generation of this analysis was as follows:
- Grand Canyon Education, Inc. Reports First Quarter 2019 Results
- Grand Canyon Education, Inc. Reports Fourth Quarter and Full Year 2018 Results
- Grand Canyon Education Signs Definitive Agreement to Acquire Orbis Education Services
- Grand Canyon Education, Inc. Reports Third Quarter 2018 Results
- Grand Canyon Education Hires Vince Grell To Lead Partnership Efforts
About author

Online


Add a comment
Comments
0 comments on the analysis GRAND CANYON EDUCATION INC. - Daily