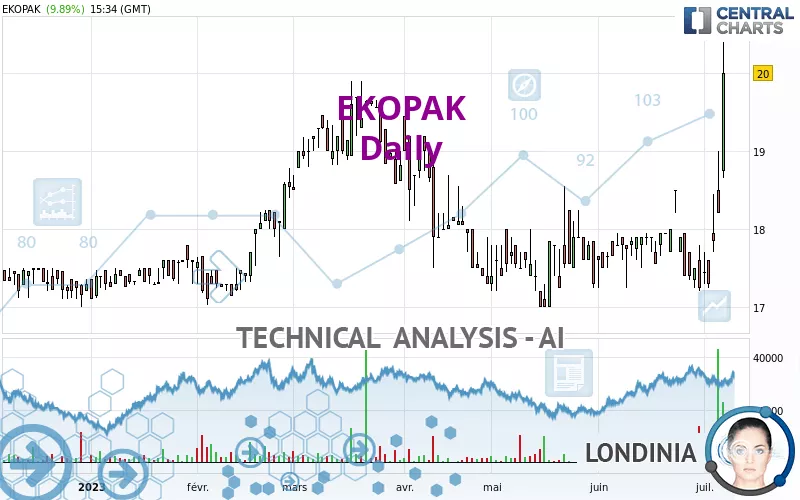
EKOPAK - Daily - Technical analysis published on 07/10/2023 (GMT)
- 132
- 0
Click here for a new analysis!
- Timeframe : Daily
- - Analysis generated on
- Status : INVALID
Summary of the analysis

Additional analysis
Quotes
The EKOPAK price is 20.00 EUR. On the day, this instrument gained +9.89% with the lowest point at 18.65 EUR and the highest point at 20.40 EUR. The deviation from the price is +7.24% for the low point and -1.96% for the high point.Here is a more detailed summary of the historical variations registered by EKOPAK:
New HIGH record (1st january)
Type : Bullish
Timeframe : Weekly
New HIGH record (1 month)
Type : Bullish
Timeframe : Weekly
The Central Volumes scanner notes the presence of abnormal volumes:
Abnormal volumes
Timeframe : 5 days
Technical
A technical analysis in Daily of this EKOPAK chart shows a bullish trend. The signals returned by the moving averages are 78.57% bullish. This bullish trend is reinforced by the strong signals currently being given by short-term moving averages. The Central Indicators market scanner is currently detecting a bullish signal that could impact this trend:
Bullish trend reversal : adaptative moving average 100
Type : Bullish
Timeframe : Daily
In fact, according to the parameters integrated into the Central Analyzer system, 14 technical indicators out of 18 analysed are currently bullish. Caution: the Central Indicators scanner currently detects an excess:
RSI indicator is overbought : over 70
Type : Neutral
Timeframe : Daily
CCI indicator is overbought : over 100
Type : Neutral
Timeframe : Daily
Williams %R indicator is overbought : over -20
Type : Neutral
Timeframe : Daily
Pivot points : price is over resistance 3
Type : Neutral
Timeframe : Daily
Pivot points : price is over resistance 3
Type : Neutral
Timeframe : Weekly
Ichimoku : price is over the cloud
Type : Bullish
Timeframe : Daily
SuperTrend indicator bullish reversal
Type : Bullish
Timeframe : Daily
MACD indicator is back over 0
Type : Bullish
Timeframe : Daily
Central Patterns, the market scanner focusing on chart patterns, resistances and supports found these results:
Near horizontal resistance
Type : Bearish
Timeframe : Daily
Resistance of channel is broken
Type : Bullish
Timeframe : Daily
The presence of a bullish Japanese candlestick pattern detected by Central Candlesticks that could cause a very short term rebound was also detected:
Long white line
Type : Bullish
Timeframe : Daily
| S3 | S2 | S1 | Price | R1 | |
|---|---|---|---|---|---|
| ProTrendLines | 18.19 | 18.50 | 19.70 | 20.00 | 21.40 |
| Change (%) | -9.05% | -7.50% | -1.50% | - | +7.00% |
| Change | -1.81 | -1.50 | -0.30 | - | +1.40 |
| Level | Minor | Minor | Intermediate | - | Major |
Pivot points can also be used to set your price objectives. Here is the price situation in relation to pivot points:
| Pivot points | S3 | S2 | S1 | PP | R1 | R2 | R3 |
|---|---|---|---|---|---|---|---|
| Standard | 17.22 | 17.93 | 18.97 | 19.68 | 20.72 | 21.43 | 22.47 |
| Camarilla | 19.52 | 19.68 | 19.84 | 20.00 | 20.16 | 20.32 | 20.48 |
| Woodie | 17.38 | 18.01 | 19.13 | 19.76 | 20.88 | 21.51 | 22.63 |
| Fibonacci | 17.93 | 18.60 | 19.02 | 19.68 | 20.35 | 20.77 | 21.43 |
| Pivot points | S3 | S2 | S1 | PP | R1 | R2 | R3 |
|---|---|---|---|---|---|---|---|
| Standard | 16.23 | 16.72 | 16.98 | 17.47 | 17.73 | 18.22 | 18.48 |
| Camarilla | 17.04 | 17.11 | 17.18 | 17.25 | 17.32 | 17.39 | 17.46 |
| Woodie | 16.13 | 16.66 | 16.88 | 17.41 | 17.63 | 18.16 | 18.38 |
| Fibonacci | 16.72 | 17.00 | 17.18 | 17.47 | 17.75 | 17.93 | 18.22 |
| Pivot points | S3 | S2 | S1 | PP | R1 | R2 | R3 |
|---|---|---|---|---|---|---|---|
| Standard | 15.50 | 16.35 | 16.80 | 17.65 | 18.10 | 18.95 | 19.40 |
| Camarilla | 16.89 | 17.01 | 17.13 | 17.25 | 17.37 | 17.49 | 17.61 |
| Woodie | 15.30 | 16.25 | 16.60 | 17.55 | 17.90 | 18.85 | 19.20 |
| Fibonacci | 16.35 | 16.85 | 17.15 | 17.65 | 18.15 | 18.45 | 18.95 |
Numerical data
The following is the status of technical indicators and moving averages registered at the time this technical analysis was created:
| RSI (14): | 73.63 | |
| MACD (12,26,9): | 0.1700 | |
| Directional Movement: | 26.69 | |
| AROON (14): | 35.71 | |
| DEMA (21): | 18.10 | |
| Parabolic SAR (0,02-0,02-0,2): | 17.30 | |
| Elder Ray (13): | 1.49 | |
| Super Trend (3,10): | 17.40 | |
| Zig ZAG (10): | 20.00 | |
| VORTEX (21): | 0.9500 | |
| Stochastique (14,3,5): | 64.35 | |
| TEMA (21): | 18.29 | |
| Williams %R (14): | -12.50 | |
| Chande Momentum Oscillator (20): | 2.05 | |
| Repulse (5,40,3): | 2.5400 | |
| ROCnROLL: | 1 | |
| TRIX (15,9): | 0.0200 | |
| Courbe Coppock: | 2.47 |
| MA7: | 17.94 | |
| MA20: | 17.88 | |
| MA50: | 17.69 | |
| MA100: | 18.15 | |
| MAexp7: | 18.30 | |
| MAexp20: | 17.93 | |
| MAexp50: | 17.87 | |
| MAexp100: | 17.94 | |
| Price / MA7: | +11.48% | |
| Price / MA20: | +11.86% | |
| Price / MA50: | +13.06% | |
| Price / MA100: | +10.19% | |
| Price / MAexp7: | +9.29% | |
| Price / MAexp20: | +11.54% | |
| Price / MAexp50: | +11.92% | |
| Price / MAexp100: | +11.48% |
About author
Online


Add a comment
Comments
0 comments on the analysis EKOPAK - Daily