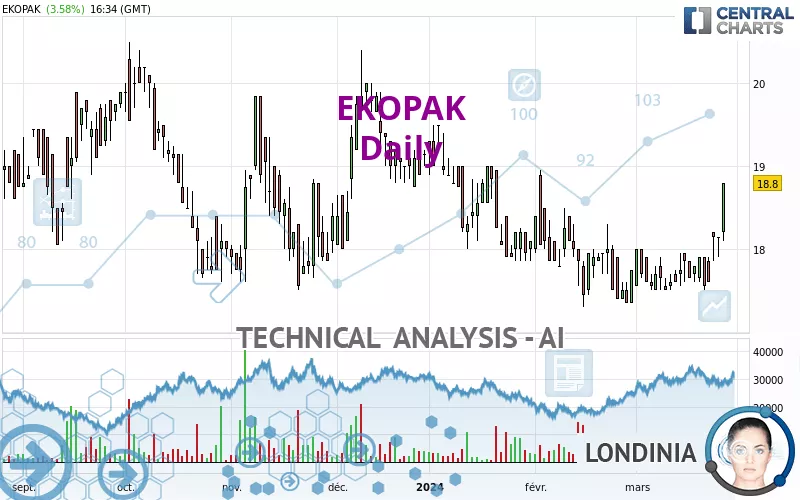
EKOPAK - Daily - Technical analysis published on 03/28/2024 (GMT)
- 137
- 0
Click here for a new analysis!
- Timeframe : Daily
- - Analysis generated on
- Status : INVALID
Summary of the analysis

Additional analysis
Quotes
The EKOPAK rating is 18.80 EUR. On the day, this instrument gained +3.58% and was between 18.10 EUR and 18.80 EUR. This implies that the price is at +3.87% from its lowest and at 0% from its highest.A bullish gap was detected at the opening by the Central Gaps scanner. There are a lot of buyers and they have the upper hand in the very short term.
Opening Gap UP
Type : Bullish
Timeframe : Openning
So that you have an overall view of the price change, here is a table showing the variations over several periods:
Near a new LOW record (1st january)
Type : Bearish
Timeframe : Weekly
New HIGH record (1 month)
Type : Bullish
Timeframe : Weekly
Technical
Technical analysis of this Daily chart of EKOPAK indicates that the overall trend is bullish. 71.43% of the signals given by moving averages are bullish. The overall trend is reinforced by the strong bullish signals from short-term moving averages. An assessment of moving averages reveals several bullish signals that could impact this trend:
Bullish price crossover with Moving Average 100
Type : Bullish
Timeframe : Daily
Bullish price crossover with adaptative moving average 50
Type : Bullish
Timeframe : Daily
Bullish price crossover with adaptative moving average 100
Type : Bullish
Timeframe : Daily
The probability of a further increase is high given the direction of the technical indicators.
Caution: the Central Indicators scanner currently detects an excess:
CCI indicator is overbought : over 100
Type : Neutral
Timeframe : Daily
Williams %R indicator is overbought : over -20
Type : Neutral
Timeframe : Daily
Pivot points : price is over resistance 3
Type : Neutral
Timeframe : Daily
Pivot points : price is over resistance 3
Type : Neutral
Timeframe : Weekly
SuperTrend indicator bullish reversal
Type : Bullish
Timeframe : Daily
An analysis of the price chart with the Central Patterns scanner (detector of chart patterns and resistances and supports) shows several results that can have an impact on the price change:
Near horizontal resistance
Type : Bearish
Timeframe : Daily
Resistance of channel is broken
Type : Bullish
Timeframe : Daily
No result was found by the Central Candlesticks scanner on Japanese candlesticks.
| S3 | S2 | S1 | R1 | Price | R2 | R3 | |
|---|---|---|---|---|---|---|---|
| ProTrendLines | 17.12 | 17.55 | 18.19 | 18.80 | 18.80 | 19.51 | 20.00 |
| Change (%) | -8.94% | -6.65% | -3.24% | 0% | - | +3.78% | +6.38% |
| Change | -1.68 | -1.25 | -0.61 | 0 | - | +0.71 | +1.20 |
| Level | Major | Major | Intermediate | Major | - | Minor | Major |
Pivot points can also be used to set your price objectives. Here is the price situation in relation to pivot points:
| Pivot points | S3 | S2 | S1 | PP | R1 | R2 | R3 |
|---|---|---|---|---|---|---|---|
| Standard | 17.63 | 17.87 | 18.33 | 18.57 | 19.03 | 19.27 | 19.73 |
| Camarilla | 18.61 | 18.67 | 18.74 | 18.80 | 18.86 | 18.93 | 18.99 |
| Woodie | 17.75 | 17.93 | 18.45 | 18.63 | 19.15 | 19.33 | 19.85 |
| Fibonacci | 17.87 | 18.13 | 18.30 | 18.57 | 18.83 | 19.00 | 19.27 |
| Pivot points | S3 | S2 | S1 | PP | R1 | R2 | R3 |
|---|---|---|---|---|---|---|---|
| Standard | 17.03 | 17.27 | 17.43 | 17.67 | 17.83 | 18.07 | 18.23 |
| Camarilla | 17.49 | 17.53 | 17.56 | 17.60 | 17.64 | 17.67 | 17.71 |
| Woodie | 17.00 | 17.25 | 17.40 | 17.65 | 17.80 | 18.05 | 18.20 |
| Fibonacci | 17.27 | 17.42 | 17.51 | 17.67 | 17.82 | 17.91 | 18.07 |
| Pivot points | S3 | S2 | S1 | PP | R1 | R2 | R3 |
|---|---|---|---|---|---|---|---|
| Standard | 15.40 | 16.35 | 17.05 | 18.00 | 18.70 | 19.65 | 20.35 |
| Camarilla | 17.30 | 17.45 | 17.60 | 17.75 | 17.90 | 18.05 | 18.20 |
| Woodie | 15.28 | 16.29 | 16.93 | 17.94 | 18.58 | 19.59 | 20.23 |
| Fibonacci | 16.35 | 16.98 | 17.37 | 18.00 | 18.63 | 19.02 | 19.65 |
Numerical data
The following is the status of technical indicators and moving averages registered at the time this technical analysis was created:
| RSI (14): | 67.01 | |
| MACD (12,26,9): | 0.0900 | |
| Directional Movement: | 21.64 | |
| AROON (14): | 100.00 | |
| DEMA (21): | 17.94 | |
| Parabolic SAR (0,02-0,02-0,2): | 17.38 | |
| Elder Ray (13): | 0.50 | |
| Super Trend (3,10): | 17.34 | |
| Zig ZAG (10): | 18.80 | |
| VORTEX (21): | 1.0600 | |
| Stochastique (14,3,5): | 95.24 | |
| TEMA (21): | 18.14 | |
| Williams %R (14): | 0.00 | |
| Chande Momentum Oscillator (20): | 1.30 | |
| Repulse (5,40,3): | 4.6900 | |
| ROCnROLL: | 1 | |
| TRIX (15,9): | -0.0300 | |
| Courbe Coppock: | 4.56 |
| MA7: | 17.99 | |
| MA20: | 17.79 | |
| MA50: | 17.91 | |
| MA100: | 18.35 | |
| MAexp7: | 18.11 | |
| MAexp20: | 17.89 | |
| MAexp50: | 17.98 | |
| MAexp100: | 18.20 | |
| Price / MA7: | +4.50% | |
| Price / MA20: | +5.68% | |
| Price / MA50: | +4.97% | |
| Price / MA100: | +2.45% | |
| Price / MAexp7: | +3.81% | |
| Price / MAexp20: | +5.09% | |
| Price / MAexp50: | +4.56% | |
| Price / MAexp100: | +3.30% |
About author
Online


Add a comment
Comments
0 comments on the analysis EKOPAK - Daily