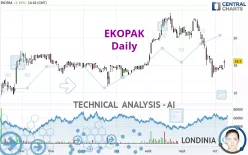
EKOPAK - Daily - Technical analysis published on 10/11/2022 (GMT)
- 142
- 0
Click here for a new analysis!
- Timeframe : Daily
- - Analysis generated on
- Status : TARGET REACHED

Summary of the analysis

Additional analysis
Quotes
EKOPAK rating 18.30 EUR. The price registered an increase of +3.39% on the session and was between 17.80 EUR and 18.44 EUR. This implies that the price is at +2.81% from its lowest and at -0.76% from its highest.The Central Gaps scanner detects a bullish gap which is a sign that buyers have taken the lead in the very short term.
Opening Gap UP
Type : Bullish
Timeframe : Openning
A study of price movements over other periods shows the following variations:
Near a new LOW record (1 month)
Type : Bearish
Timeframe : Weekly
Technical
Technical analysis of this Daily chart of EKOPAK indicates that the overall trend is bearish. 75.00% of the signals given by moving averages are bearish. This bearish trend is supported by the strong bearish signals given by short-term moving averages. The Central Indicators market scanner currently does not detect any result that concerns moving averages.
The technical indicators are generally neutral. They do not provide relevant information on the direction of future price movements.
Central Indicators, the detector scanner for these technical indicators has recently detected several signals:
Pivot points : price is over resistance 1
Type : Neutral
Timeframe : Weekly
Pivot points : price is over resistance 3
Type : Neutral
Timeframe : Daily
Parabolic SAR indicator bullish reversal
Type : Bullish
Timeframe : Daily
The Central Patterns scanner, which studies chart patterns, resistances and supports, has identified these signals:
Near resistance of channel
Type : Bearish
Timeframe : Daily
Horizontal resistance is broken
Type : Bullish
Timeframe : Daily
Central Candlesticks, the scanner specialised in Japanese candlesticks, detects this inversion signal that could impact the current short-term trend:
Doji
Type : Neutral
Timeframe : Daily
| S3 | S2 | S1 | Price | R1 | R2 | R3 | |
|---|---|---|---|---|---|---|---|
| ProTrendLines | 16.68 | 17.40 | 18.00 | 18.30 | 18.80 | 19.60 | 21.39 |
| Change (%) | -8.85% | -4.92% | -1.64% | - | +2.73% | +7.10% | +16.89% |
| Change | -1.62 | -0.90 | -0.30 | - | +0.50 | +1.30 | +3.09 |
| Level | Minor | Major | Minor | - | Intermediate | Minor | Intermediate |
Attention could also be paid to pivot points to set price objectives:
| Pivot points | S3 | S2 | S1 | PP | R1 | R2 | R3 |
|---|---|---|---|---|---|---|---|
| Standard | 17.30 | 17.50 | 17.60 | 17.80 | 17.90 | 18.10 | 18.20 |
| Camarilla | 17.62 | 17.65 | 17.67 | 17.70 | 17.73 | 17.76 | 17.78 |
| Woodie | 17.25 | 17.48 | 17.55 | 17.78 | 17.85 | 18.08 | 18.15 |
| Fibonacci | 17.50 | 17.62 | 17.69 | 17.80 | 17.92 | 17.99 | 18.10 |
| Pivot points | S3 | S2 | S1 | PP | R1 | R2 | R3 |
|---|---|---|---|---|---|---|---|
| Standard | 17.07 | 17.29 | 17.55 | 17.77 | 18.03 | 18.25 | 18.51 |
| Camarilla | 17.67 | 17.71 | 17.76 | 17.80 | 17.84 | 17.89 | 17.93 |
| Woodie | 17.08 | 17.30 | 17.56 | 17.78 | 18.04 | 18.26 | 18.52 |
| Fibonacci | 17.29 | 17.48 | 17.59 | 17.77 | 17.96 | 18.07 | 18.25 |
| Pivot points | S3 | S2 | S1 | PP | R1 | R2 | R3 |
|---|---|---|---|---|---|---|---|
| Standard | 11.67 | 14.39 | 15.95 | 18.67 | 20.23 | 22.95 | 24.51 |
| Camarilla | 16.32 | 16.72 | 17.11 | 17.50 | 17.89 | 18.29 | 18.68 |
| Woodie | 11.08 | 14.10 | 15.36 | 18.38 | 19.64 | 22.66 | 23.92 |
| Fibonacci | 14.39 | 16.03 | 17.04 | 18.67 | 20.31 | 21.32 | 22.95 |
Numerical data
The following is the status of technical indicators and moving averages registered at the time this technical analysis was created:
| RSI (14): | 41.49 | |
| MACD (12,26,9): | -0.6300 | |
| Directional Movement: | -14.15 | |
| AROON (14): | -35.72 | |
| DEMA (21): | 17.78 | |
| Parabolic SAR (0,02-0,02-0,2): | 17.12 | |
| Elder Ray (13): | -0.09 | |
| Super Trend (3,10): | 19.37 | |
| Zig ZAG (10): | 18.20 | |
| VORTEX (21): | 0.7200 | |
| Stochastique (14,3,5): | 26.45 | |
| TEMA (21): | 17.30 | |
| Williams %R (14): | -62.50 | |
| Chande Momentum Oscillator (20): | -0.22 | |
| Repulse (5,40,3): | -1.6500 | |
| ROCnROLL: | -1 | |
| TRIX (15,9): | -0.4600 | |
| Courbe Coppock: | 21.49 |
| MA7: | 17.84 | |
| MA20: | 18.77 | |
| MA50: | 19.83 | |
| MA100: | 18.83 | |
| MAexp7: | 17.96 | |
| MAexp20: | 18.56 | |
| MAexp50: | 19.09 | |
| MAexp100: | 18.92 | |
| Price / MA7: | +2.58% | |
| Price / MA20: | -2.50% | |
| Price / MA50: | -7.72% | |
| Price / MA100: | -2.81% | |
| Price / MAexp7: | +1.89% | |
| Price / MAexp20: | -1.40% | |
| Price / MAexp50: | -4.14% | |
| Price / MAexp100: | -3.28% |
About author
Online


Add a comment
Comments
0 comments on the analysis EKOPAK - Daily