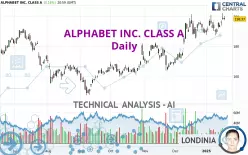
ALPHABET INC. CLASS A - Daily - Technical analysis published on 01/23/2025 (GMT)
- 286
- 0
Click here for a new analysis!
- Timeframe : Daily
- - Analysis generated on
- Status : INVALID

Summary of the analysis

Additional analysis
Quotes
ALPHABET INC. CLASS A rating 198.37 USD. On the day, this instrument gained +0.16% with the lowest point at 197.53 USD and the highest point at 200.48 USD. The deviation from the price is +0.43% for the low point and -1.05% for the high point.A study of price movements over other periods shows the following variations:
New HIGH record (5 years)
Type : Bullish
Timeframe : Weekly
Near a new HIGH record (1 year)
Type : Bullish
Timeframe : Weekly
Near a new HIGH record (1st january)
Type : Bullish
Timeframe : Weekly
Near a new HIGH record (1 month)
Type : Bullish
Timeframe : Weekly
Technical
Technical analysis of this Daily chart of ALPHABET INC. CLASS A indicates that the overall trend is strongly bullish. The signals given by the moving averages are 92.86% bullish. This strong bullish trend is confirmed by the strong signals currently being given by short-term moving averages. The Central Indicators market scanner currently does not detect any result that concerns moving averages.
Technical indicators are strongly bullish, suggesting that the price increase should continue.
But beware of excesses. The Central Indicators scanner currently detects this:
CCI indicator is overbought : over 100
Type : Neutral
Timeframe : Daily
An analysis of the price chart with the Central Patterns scanner (detector of chart patterns and resistances and supports) shows several results that can have an impact on the price change:
Near resistance of channel
Type : Bearish
Timeframe : Daily
Near horizontal support
Type : Bullish
Timeframe : Daily
The Central Candlesticks scanner which studies Japanese candlesticks did not detect anything.
| S3 | S2 | S1 | Price | |
|---|---|---|---|---|
| ProTrendLines | 181.45 | 190.72 | 196.75 | 198.37 |
| Change (%) | -8.53% | -3.86% | -0.82% | - |
| Change | -16.92 | -7.65 | -1.62 | - |
| Level | Minor | Major | Major | - |
Pivot points can also be used to set your price objectives. Here is the price situation in relation to pivot points:
| Pivot points | S3 | S2 | S1 | PP | R1 | R2 | R3 |
|---|---|---|---|---|---|---|---|
| Standard | 194.16 | 195.84 | 197.11 | 198.79 | 200.06 | 201.74 | 203.01 |
| Camarilla | 197.56 | 197.83 | 198.10 | 198.37 | 198.64 | 198.91 | 199.18 |
| Woodie | 193.95 | 195.74 | 196.90 | 198.69 | 199.85 | 201.64 | 202.80 |
| Fibonacci | 195.84 | 196.97 | 197.67 | 198.79 | 199.92 | 200.62 | 201.74 |
| Pivot points | S3 | S2 | S1 | PP | R1 | R2 | R3 |
|---|---|---|---|---|---|---|---|
| Standard | 179.96 | 183.66 | 189.83 | 193.53 | 199.70 | 203.40 | 209.57 |
| Camarilla | 193.29 | 194.19 | 195.10 | 196.00 | 196.91 | 197.81 | 198.71 |
| Woodie | 181.20 | 184.28 | 191.07 | 194.15 | 200.94 | 204.02 | 210.81 |
| Fibonacci | 183.66 | 187.43 | 189.76 | 193.53 | 197.30 | 199.63 | 203.40 |
| Pivot points | S3 | S2 | S1 | PP | R1 | R2 | R3 |
|---|---|---|---|---|---|---|---|
| Standard | 138.27 | 153.33 | 171.31 | 186.37 | 204.35 | 219.41 | 237.39 |
| Camarilla | 180.21 | 183.24 | 186.27 | 189.30 | 192.33 | 195.36 | 198.39 |
| Woodie | 139.74 | 154.06 | 172.78 | 187.10 | 205.82 | 220.14 | 238.86 |
| Fibonacci | 153.33 | 165.95 | 173.75 | 186.37 | 198.99 | 206.79 | 219.41 |
Numerical data
The following are the details of the technical indicators and moving averages that were collected to generate this technical analysis:
| RSI (14): | 61.71 | |
| MACD (12,26,9): | 3.2600 | |
| Directional Movement: | 16.26 | |
| AROON (14): | 35.72 | |
| DEMA (21): | 197.31 | |
| Parabolic SAR (0,02-0,02-0,2): | 187.66 | |
| Elder Ray (13): | 4.73 | |
| Super Trend (3,10): | 185.39 | |
| Zig ZAG (10): | 198.37 | |
| VORTEX (21): | 1.0100 | |
| Stochastique (14,3,5): | 69.56 | |
| TEMA (21): | 196.78 | |
| Williams %R (14): | -26.26 | |
| Chande Momentum Oscillator (20): | 8.94 | |
| Repulse (5,40,3): | -1.8500 | |
| ROCnROLL: | 1 | |
| TRIX (15,9): | 0.2700 | |
| Courbe Coppock: | 2.81 |
| MA7: | 194.51 | |
| MA20: | 193.61 | |
| MA50: | 184.48 | |
| MA100: | 173.56 | |
| MAexp7: | 195.64 | |
| MAexp20: | 192.70 | |
| MAexp50: | 185.77 | |
| MAexp100: | 178.64 | |
| Price / MA7: | +1.98% | |
| Price / MA20: | +2.46% | |
| Price / MA50: | +7.53% | |
| Price / MA100: | +14.29% | |
| Price / MAexp7: | +1.40% | |
| Price / MAexp20: | +2.94% | |
| Price / MAexp50: | +6.78% | |
| Price / MAexp100: | +11.04% |
News
The last news published on ALPHABET INC. CLASS A at the time of the generation of this analysis was as follows:
-
 Zuckerberg Aims to Rival OpenAI, Google With New Llama AI Model
-
What is Google most excited about right now? | Matt Brittin, EMEA President | The Big Question
- Informatica Brings AI-Powered Cloud Native Data Governance to Google Cloud Customers Through Expanded Partnership
- Qualifire Joins the Google Cloud ISV Startup Springboard Program
-
Google reveals most popular cookies #shorts
About author

Online


Add a comment
Comments
0 comments on the analysis ALPHABET INC. CLASS A - Daily