ALPHABET INC. CLASS A - Alphabet Inc. - 10/17/2023 (GMT)
- 237
- 0
- Who voted?
- Timeframe : Daily

ALPHABET INC. CLASS A Chart
Are you looking for opportunities in American stocks?
DISCOVER LONDINIA OPPORTUNITIES...
DISCOVER LONDINIA OPPORTUNITIES...
Shares of Alphabet Inc. (symbol ‘GOOGL’) rose by around 10% in the third quarter of the year. The company’s earnings report for the fiscal quarter ending September 2023 is expected to be released on Tuesday 24th of October. The consensus EPS is $1.45, against $1.06 of the same quarter last year.
‘The company’s debt is at its lowest since the third quarter of 2020 and it consists of just shy of 12%. The company also has a pretty remarkable current ratio which stands at 217% as of 30/06/2023 meaning that it has the ability to repay its short term liabilities with the current assets in possession. The ratio of total assets to total liabilities is at an astonishing 3:1 while the net income has increased by almost 15% year over year in the second quarter of 2023. All in all Google has been one of the investors and traders favorite and it is clear why just by looking at the financials of the company. ‘ said Antreas Themistokleous, trading specialist at Exness.
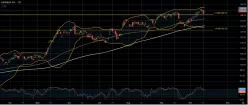
From the technical analysis perspective the price has been trading with relatively steady bullish momentum throughout the majority of the quarter making consistent gains on its share. Currently the price is trading above all its technical indicators like the moving averages and Fibonacci levels and is retesting the previous high of $139-$140 area.
The 50 day moving average is trading above the 100 day moving average validating the bullish momentum but on the other hand the Stochastic oscillator is in the extreme overbought levels possibly suggesting that a correction to the downside before resuming the overall bullish rally might be possible in the near short term outlook.
‘The company’s debt is at its lowest since the third quarter of 2020 and it consists of just shy of 12%. The company also has a pretty remarkable current ratio which stands at 217% as of 30/06/2023 meaning that it has the ability to repay its short term liabilities with the current assets in possession. The ratio of total assets to total liabilities is at an astonishing 3:1 while the net income has increased by almost 15% year over year in the second quarter of 2023. All in all Google has been one of the investors and traders favorite and it is clear why just by looking at the financials of the company. ‘ said Antreas Themistokleous, trading specialist at Exness.
From the technical analysis perspective the price has been trading with relatively steady bullish momentum throughout the majority of the quarter making consistent gains on its share. Currently the price is trading above all its technical indicators like the moving averages and Fibonacci levels and is retesting the previous high of $139-$140 area.
The 50 day moving average is trading above the 100 day moving average validating the bullish momentum but on the other hand the Stochastic oscillator is in the extreme overbought levels possibly suggesting that a correction to the downside before resuming the overall bullish rally might be possible in the near short term outlook.
This member declared not having a position on this financial instrument or a related financial instrument.
About author

Offline


Add a comment
Comments
0 comments on the analysis ALPHABET INC. CLASS A - Daily