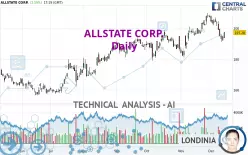
ALLSTATE CORP. - Daily - Technical analysis published on 12/13/2024 (GMT)
- 147
- 0
Click here for a new analysis!
- Timeframe : Daily
- - Analysis generated on
- Status : LEVEL MAINTAINED

Summary of the analysis

Additional analysis
Quotes
The ALLSTATE CORP. price is 197.28 USD. The price registered an increase of +2.59% on the session and was between 193.63 USD and 197.69 USD. This implies that the price is at +1.89% from its lowest and at -0.21% from its highest.A study of price movements over other periods shows the following variations:
Near a new HIGH record (5 years)
Type : Bullish
Timeframe : Weekly
Near a new LOW record (1 month)
Type : Bearish
Timeframe : Weekly
Technical
Technical analysis of ALLSTATE CORP. in Daily shows an overall bullish trend. The signals given by moving averages are 75.00% bullish. This bullish trend could slow down given the neutral signals currently being given by short-term moving averages. The Central Indicators scanner detects bullish signals on moving averages that could impact this trend:
Bullish price crossover with Moving Average 50
Type : Bullish
Timeframe : Daily
Bullish price crossover with adaptative moving average 50
Type : Bullish
Timeframe : Daily
In fact, only 8 technical indicators out of 18 studied are currently bearish. Central Indicators, the scanner specialised in technical indicators, has identified this signal:
Pivot points : price is under support 3
Type : Neutral
Timeframe : Weekly
The Central Patterns scanner, which studies chart patterns, resistances and supports, has identified this signal:
Support of channel is broken
Type : Bearish
Timeframe : Daily
The Central Candlesticks scanner which studies Japanese candlesticks did not detect anything.
| S3 | S2 | S1 | Price | R1 | |
|---|---|---|---|---|---|
| ProTrendLines | 172.81 | 181.56 | 194.81 | 197.28 | 207.46 |
| Change (%) | -12.40% | -7.97% | -1.25% | - | +5.16% |
| Change | -24.47 | -15.72 | -2.47 | - | +10.18 |
| Level | Major | Major | Intermediate | - | Major |
To determine price objectives, it is also possible to use the pivot points. Here is the price position in relation to pivot points:
| Pivot points | S3 | S2 | S1 | PP | R1 | R2 | R3 |
|---|---|---|---|---|---|---|---|
| Standard | 187.93 | 189.93 | 191.12 | 193.12 | 194.31 | 196.31 | 197.50 |
| Camarilla | 191.42 | 191.72 | 192.01 | 192.30 | 192.59 | 192.89 | 193.18 |
| Woodie | 187.52 | 189.73 | 190.71 | 192.92 | 193.90 | 196.11 | 197.09 |
| Fibonacci | 189.93 | 191.15 | 191.91 | 193.12 | 194.34 | 195.10 | 196.31 |
| Pivot points | S3 | S2 | S1 | PP | R1 | R2 | R3 |
|---|---|---|---|---|---|---|---|
| Standard | 193.91 | 197.73 | 200.68 | 204.50 | 207.45 | 211.27 | 214.22 |
| Camarilla | 201.78 | 202.40 | 203.02 | 203.64 | 204.26 | 204.88 | 205.50 |
| Woodie | 193.49 | 197.51 | 200.26 | 204.28 | 207.03 | 211.05 | 213.80 |
| Fibonacci | 197.73 | 200.31 | 201.91 | 204.50 | 207.08 | 208.68 | 211.27 |
| Pivot points | S3 | S2 | S1 | PP | R1 | R2 | R3 |
|---|---|---|---|---|---|---|---|
| Standard | 160.44 | 170.44 | 188.95 | 198.95 | 217.46 | 227.46 | 245.97 |
| Camarilla | 199.62 | 202.23 | 204.85 | 207.46 | 210.07 | 212.69 | 215.30 |
| Woodie | 164.70 | 172.57 | 193.21 | 201.08 | 221.72 | 229.59 | 250.23 |
| Fibonacci | 170.44 | 181.33 | 188.06 | 198.95 | 209.84 | 216.57 | 227.46 |
Numerical data
The following is the status of technical indicators and moving averages registered at the time this technical analysis was created:
| RSI (14): | 48.64 | |
| MACD (12,26,9): | 0.6100 | |
| Directional Movement: | -4.83 | |
| AROON (14): | -64.28 | |
| DEMA (21): | 200.14 | |
| Parabolic SAR (0,02-0,02-0,2): | 205.06 | |
| Elder Ray (13): | -3.05 | |
| Super Trend (3,10): | 205.37 | |
| Zig ZAG (10): | 197.05 | |
| VORTEX (21): | 0.9300 | |
| Stochastique (14,3,5): | 17.59 | |
| TEMA (21): | 198.42 | |
| Williams %R (14): | -65.58 | |
| Chande Momentum Oscillator (20): | -9.57 | |
| Repulse (5,40,3): | -0.5700 | |
| ROCnROLL: | -1 | |
| TRIX (15,9): | 0.1800 | |
| Courbe Coppock: | 2.72 |
| MA7: | 197.82 | |
| MA20: | 200.64 | |
| MA50: | 193.96 | |
| MA100: | 187.49 | |
| MAexp7: | 197.28 | |
| MAexp20: | 198.51 | |
| MAexp50: | 194.67 | |
| MAexp100: | 187.83 | |
| Price / MA7: | -0.27% | |
| Price / MA20: | -1.67% | |
| Price / MA50: | +1.71% | |
| Price / MA100: | +5.22% | |
| Price / MAexp7: | -0% | |
| Price / MAexp20: | -0.62% | |
| Price / MAexp50: | +1.34% | |
| Price / MAexp100: | +5.03% |
News
The last news published on ALLSTATE CORP. at the time of the generation of this analysis was as follows:
- RM LAW Announces Investigation of The Allstate Corporation
- Lifshitz & Miller LLP Announces Investigation of Allstate Corporation, Blue Buffalo Pet Products, Inc., Express Scripts Holding Company, Funko, Inc., PHH Corporation, Seven Stars Cloud Group, Inc., United Therapeutics Corporation, and Sprouts Farmers Market, Inc.
- American Red Cross of Central Oklahoma and The Allstate Foundation prepare residents for severe weather season
- Long-Term Allstate (ALL) Investors: Johnson Fistel Investigates Allstate; Encourages Investors Owning Since before November 2014 to Contact the Firm
- Allstate Named One of the 2018 "Top 70 Companies for Executive Women"
About author
Online


Add a comment
Comments
0 comments on the analysis ALLSTATE CORP. - Daily