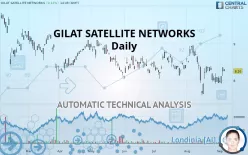
GILAT SATELLITE NETWORKS - Daily - Technical analysis published on 09/06/2019 (GMT)
- 323
- 0
Click here for a new analysis!
- Timeframe : Daily
- - Analysis generated on
- Status : TARGET REACHED

Summary of the analysis

Additional analysis
Quotes
The GILAT SATELLITE NETWORKS price is 8.26 USD. On the day, this instrument gained +0.12% and was between 8.25 USD and 8.31 USD. This implies that the price is at +0.12% from its lowest and at -0.60% from its highest.So that you have an overall view of the price change, here is a table showing the variations over several periods:
Technical
Technical analysis of this Daily chart of GILAT SATELLITE NETWORKS indicates that the overall trend is bearish. 67.86% of the signals given by moving averages are bearish. Caution: as the signals currently given by short-term moving averages are rather neutral, the bearish trend could slow down. The Central Indicators scanner detects bullish signals on moving averages that could impact this trend:
Bullish trend reversal : adaptative moving average 20
Type : Bullish
Timeframe : Daily
Bullish price crossover with Moving Average 20
Type : Bullish
Timeframe : Daily
In fact, only 9 technical indicators out of 18 studied are currently positioned bullish. Caution: the Central Indicators scanner currently detects an excess:
MACD indicator: bullish divergence
Type : Bullish
Timeframe : Daily
RSI indicator: bullish divergence
Type : Bullish
Timeframe : Daily
Williams %R indicator is overbought : over -20
Type : Neutral
Timeframe : Daily
Pivot points : price is over resistance 1
Type : Neutral
Timeframe : Weekly
RSI indicator is back over 50
Type : Bullish
Timeframe : Daily
Parabolic SAR indicator bullish reversal
Type : Bullish
Timeframe : Daily
Williams %R indicator is back over -50
Type : Bullish
Timeframe : Daily
Central Patterns, the market scanner focusing on chart patterns, resistances and supports found this result:
Near resistance of channel
Type : Bearish
Timeframe : Daily
The Central Candlesticks scanner which studies Japanese candlesticks did not detect anything.
| S3 | S2 | S1 | Price | R1 | R2 | R3 | |
|---|---|---|---|---|---|---|---|
| ProTrendLines | 7.67 | 7.93 | 8.12 | 8.26 | 8.93 | 9.41 | 9.76 |
| Change (%) | -7.14% | -4.00% | -1.69% | - | +8.11% | +13.92% | +18.16% |
| Change | -0.59 | -0.33 | -0.14 | - | +0.67 | +1.15 | +1.50 |
| Level | Minor | Major | Intermediate | - | Intermediate | Major | Intermediate |
Attention could also be paid to pivot points to set price objectives:
| Pivot points | S3 | S2 | S1 | PP | R1 | R2 | R3 |
|---|---|---|---|---|---|---|---|
| Standard | 7.89 | 8.00 | 8.13 | 8.24 | 8.37 | 8.48 | 8.61 |
| Camarilla | 8.18 | 8.21 | 8.23 | 8.25 | 8.27 | 8.29 | 8.32 |
| Woodie | 7.89 | 8.01 | 8.13 | 8.25 | 8.37 | 8.49 | 8.61 |
| Fibonacci | 8.00 | 8.10 | 8.15 | 8.24 | 8.34 | 8.39 | 8.48 |
| Pivot points | S3 | S2 | S1 | PP | R1 | R2 | R3 |
|---|---|---|---|---|---|---|---|
| Standard | 7.63 | 7.77 | 7.92 | 8.06 | 8.21 | 8.35 | 8.50 |
| Camarilla | 7.99 | 8.02 | 8.04 | 8.07 | 8.10 | 8.12 | 8.15 |
| Woodie | 7.64 | 7.77 | 7.93 | 8.06 | 8.22 | 8.35 | 8.51 |
| Fibonacci | 7.77 | 7.88 | 7.95 | 8.06 | 8.17 | 8.24 | 8.35 |
| Pivot points | S3 | S2 | S1 | PP | R1 | R2 | R3 |
|---|---|---|---|---|---|---|---|
| Standard | 6.11 | 6.86 | 7.46 | 8.21 | 8.81 | 9.56 | 10.16 |
| Camarilla | 7.70 | 7.82 | 7.95 | 8.07 | 8.19 | 8.32 | 8.44 |
| Woodie | 6.05 | 6.82 | 7.40 | 8.17 | 8.75 | 9.52 | 10.10 |
| Fibonacci | 6.86 | 7.37 | 7.69 | 8.21 | 8.72 | 9.04 | 9.56 |
Numerical data
The following is the status of the technical indicators and moving averages at the time of publication of this technical analysis:
| RSI (14): | 51.13 | |
| MACD (12,26,9): | -0.0800 | |
| Directional Movement: | -0.58 | |
| AROON (14): | 35.71 | |
| DEMA (21): | 8.09 | |
| Parabolic SAR (0,02-0,02-0,2): | 7.62 | |
| Elder Ray (13): | 0.12 | |
| Super Trend (3,10): | 7.69 | |
| Zig ZAG (10): | 8.29 | |
| VORTEX (21): | 0.8700 | |
| Stochastique (14,3,5): | 67.93 | |
| TEMA (21): | 8.07 | |
| Williams %R (14): | -20.83 | |
| Chande Momentum Oscillator (20): | -0.08 | |
| Repulse (5,40,3): | -1.0400 | |
| ROCnROLL: | -1 | |
| TRIX (15,9): | -0.1600 | |
| Courbe Coppock: | 2.20 |
| MA7: | 8.10 | |
| MA20: | 8.17 | |
| MA50: | 8.36 | |
| MA100: | 8.49 | |
| MAexp7: | 8.15 | |
| MAexp20: | 8.20 | |
| MAexp50: | 8.32 | |
| MAexp100: | 8.46 | |
| Price / MA7: | +1.98% | |
| Price / MA20: | +1.10% | |
| Price / MA50: | -1.20% | |
| Price / MA100: | -2.71% | |
| Price / MAexp7: | +1.35% | |
| Price / MAexp20: | +0.73% | |
| Price / MAexp50: | -0.72% | |
| Price / MAexp100: | -2.36% |
News
Don"t forget to follow the news on GILAT SATELLITE NETWORKS. At the time of publication of this analysis, the latest news was as follows:
- NTT DOCOMO Awards Gilat an LTE Satellite Backhaul Project to Expand Its LTE Footprint
- Gilat Reports Continued Profitability Growth in Q2 2019
- Gilat Will Provide Aero Antennas With Initial Agreement for Tens of Millions of Dollars to a Tier-1 Business Aviation Service Provider
- Gilat Achieves Critical Milestone in Peru With Approval to Enter Operational Phase, Unlocking Access to Revenue of ~$12M Per Annum From Telecom Project Awarded in 2015
- Globe Awards Gilat a Three-year Multi-million US Dollar Contract for Delivering Satellite Based WiFi in Addition to Cellular Backhaul Services
About author

Online


Add a comment
Comments
0 comments on the analysis GILAT SATELLITE NETWORKS - Daily