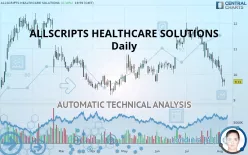
VERADIGM INC. - Daily - Technical analysis published on 08/07/2019 (GMT)
- 341
- 0
- Who voted?
Click here for a new analysis!
- Timeframe : Daily
- - Analysis generated on
- Status : TARGET REACHED

Summary of the analysis
Additional analysis
Quotes
The ALLSCRIPTS HEALTHCARE SOLUTIONS rating is 9.71 USD. On the day, this instrument gained +0.10% with the lowest point at 9.56 USD and the highest point at 9.84 USD. The deviation from the price is +1.57% for the low point and -1.32% for the high point.A bullish opening was detected by the Central Gaps scanner. Buyers are trying to impose a bullish momentum in the very short term.
Bullish opening
Type : Bullish
Timeframe : Openning
A study of price movements over other periods shows the following variations:
Near a new LOW record (1st january)
Type : Bearish
Timeframe : Weekly
Near a new LOW record (1 month)
Type : Bearish
Timeframe : Weekly
Technical
Technical analysis of ALLSCRIPTS HEALTHCARE SOLUTIONS in Daily shows a overall strongly bearish trend. 82.14% of the signals given by moving averages are bearish. The overall trend is supported by the strong bearish signals from short-term moving averages. The Central Indicators scanner does not detect any result on moving averages that would impact this trend.
In fact, 13 technical indicators on 18 studied are currently bearish. Caution: the Central Indicators scanner currently detects an excess:
RSI indicator is oversold : under 30
Type : Neutral
Timeframe : Daily
CCI indicator is oversold : under -100
Type : Neutral
Timeframe : Daily
Williams %R indicator is oversold : under -80
Type : Neutral
Timeframe : Daily
Price is back under the pivot point
Type : Bearish
Timeframe : Weekly
Central Patterns, the market scanner focusing on chart patterns, resistances and supports found this result:
Near horizontal support
Type : Bullish
Timeframe : Daily
The Central Candlesticks scanner which studies Japanese candlesticks did not detect anything.
| S3 | S2 | S1 | Price | R1 | R2 | R3 | |
|---|---|---|---|---|---|---|---|
| ProTrendLines | 8.64 | 8.96 | 9.48 | 9.71 | 10.00 | 10.73 | 12.17 |
| Change (%) | -11.02% | -7.72% | -2.37% | - | +2.99% | +10.50% | +25.33% |
| Change | -1.07 | -0.75 | -0.23 | - | +0.29 | +1.02 | +2.46 |
| Level | Minor | Major | Major | - | Major | Intermediate | Major |
To determine price objectives, it is also possible to use the pivot points. Here is the price position in relation to pivot points:
| Pivot points | S3 | S2 | S1 | PP | R1 | R2 | R3 |
|---|---|---|---|---|---|---|---|
| Standard | 9.16 | 9.34 | 9.52 | 9.70 | 9.88 | 10.06 | 10.24 |
| Camarilla | 9.60 | 9.63 | 9.67 | 9.70 | 9.73 | 9.77 | 9.80 |
| Woodie | 9.16 | 9.34 | 9.52 | 9.70 | 9.88 | 10.06 | 10.24 |
| Fibonacci | 9.34 | 9.48 | 9.56 | 9.70 | 9.84 | 9.92 | 10.06 |
| Pivot points | S3 | S2 | S1 | PP | R1 | R2 | R3 |
|---|---|---|---|---|---|---|---|
| Standard | 8.76 | 9.29 | 9.64 | 10.17 | 10.52 | 11.05 | 11.40 |
| Camarilla | 9.75 | 9.83 | 9.91 | 9.99 | 10.07 | 10.15 | 10.23 |
| Woodie | 8.67 | 9.25 | 9.55 | 10.13 | 10.43 | 11.01 | 11.31 |
| Fibonacci | 9.29 | 9.63 | 9.83 | 10.17 | 10.51 | 10.71 | 11.05 |
| Pivot points | S3 | S2 | S1 | PP | R1 | R2 | R3 |
|---|---|---|---|---|---|---|---|
| Standard | 7.81 | 8.99 | 9.65 | 10.83 | 11.49 | 12.67 | 13.33 |
| Camarilla | 9.79 | 9.96 | 10.13 | 10.30 | 10.47 | 10.64 | 10.81 |
| Woodie | 7.54 | 8.86 | 9.38 | 10.70 | 11.22 | 12.54 | 13.06 |
| Fibonacci | 8.99 | 9.70 | 10.13 | 10.83 | 11.54 | 11.97 | 12.67 |
Numerical data
The following are the details of the technical indicators and moving averages that were collected to generate this technical analysis:
| RSI (14): | 26.11 | |
| MACD (12,26,9): | -0.3100 | |
| Directional Movement: | -22.08 | |
| AROON (14): | -85.72 | |
| DEMA (21): | 10.21 | |
| Parabolic SAR (0,02-0,02-0,2): | 10.36 | |
| Elder Ray (13): | -0.64 | |
| Super Trend (3,10): | 10.80 | |
| Zig ZAG (10): | 9.71 | |
| VORTEX (21): | 0.7200 | |
| Stochastique (14,3,5): | 10.30 | |
| TEMA (21): | 9.85 | |
| Williams %R (14): | -89.20 | |
| Chande Momentum Oscillator (20): | -1.24 | |
| Repulse (5,40,3): | -3.0000 | |
| ROCnROLL: | 2 | |
| TRIX (15,9): | -0.2100 | |
| Courbe Coppock: | 21.23 |
| MA7: | 10.13 | |
| MA20: | 10.75 | |
| MA50: | 10.77 | |
| MA100: | 10.36 | |
| MAexp7: | 10.07 | |
| MAexp20: | 10.53 | |
| MAexp50: | 10.67 | |
| MAexp100: | 10.66 | |
| Price / MA7: | -4.15% | |
| Price / MA20: | -9.67% | |
| Price / MA50: | -9.84% | |
| Price / MA100: | -6.27% | |
| Price / MAexp7: | -3.57% | |
| Price / MAexp20: | -7.79% | |
| Price / MAexp50: | -9.00% | |
| Price / MAexp100: | -8.91% |
News
Don"t forget to follow the news on ALLSCRIPTS HEALTHCARE SOLUTIONS. At the time of publication of this analysis, the latest news was as follows:
- RM LAW Announces an Investigation of Allscripts Healthcare Solutions, Inc.
- Consolidated Research: 2019 Summary Expectations for Immunomedics, Allscripts Healthcare Solutions, Viper Energy Partners LP, Virtu Financial, FactSet Research, and MICT — Fundamental Analysis, Key Performance Indications
- Report: Developing Opportunities within Allscripts Healthcare Solutions, Jones Lang LaSalle, VOXX International, Wolverine World Wide, Verso, and Zoe's Kitchen — Future Expectations, Projections Moving into 2018
- Analysis: Positioning to Benefit within Biglari, Trustmark, Allscripts Healthcare Solutions, Agios Pharmaceuticals, Roadrunner Transportation, and OSI — Research Highlights Growth, Revenue, and Consolidated Results
- Market Trends Toward New Normal in Dynavax Technologies, Synergy Resources, Allscripts Healthcare Solutions, Plug Power, GameStop, and Newfield Exploration — Emerging Consolidated Expectations, Analyst Ratings
About author

Online


Add a comment
Comments
0 comments on the analysis VERADIGM INC. - Daily