VERADIGM INC. - Daily - Technical analysis published on 12/06/2021 (GMT)
- 300
- 0
I am delighted to see that my first price objective has been achieved. I hope you've taken advantage of it.
Click here for a new analysis!
Click here for a new analysis!
- Timeframe : Daily
- - Analysis generated on
- Status : TARGET REACHED
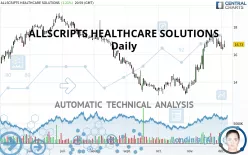

VERADIGM INC. Chart
Summary of the analysis
Trends
Short term:
Strongly bullish
Underlying:
Bullish
Technical indicators
22%
33%
44%
My opinion
Bullish above 15.95 USD
My targets
17.49 USD (+4.54%)
18.08 USD (+8.07%)
My analysis
ALLSCRIPTS HEALTHCARE SOLUTIONS is part of a very strong bullish trend. Traders may consider trading only long positions (at the time of purchase) as long as the price remains well above 15.95 USD. The next resistance located at 17.49 USD is the next bullish target to be reached. A bullish break in this resistance would boost the bullish momentum. The bullish movement could then continue towards the next resistance located at 18.08 USD. After this resistance, buyers could then target 18.78 USD.
Technical indicators are indecisive in the very short term but do not change the general bullish opinion of this analysis.
Force
0
10
4.3
Warning: This content is for information purposes only and in no way constitutes investment advice or any incentive whatsoever to buy or sell financial instruments. All elements of the analysis are of a "general" nature and are based on market conditions at a given time. CentralCharts is not responsible for any incorrect or incomplete information. Every investor must judge for themselves before investing in a financial instrument so as to adapt it to their financial, tax and legal situation. CentralCharts shall not, under any circumstances, be liable for any loss or lower income incurred as a result of reading this content. Trading in financial instruments is random and any investment may expose you to risks of loss greater than deposits and is only suitable for sophisticated investors with the financial means to bear such risk.
This analysis was given by Smurph77.
Additional analysis
Quotes
ALLSCRIPTS HEALTHCARE SOLUTIONS rating 16.73 USD. The price has increased by +1.21% since the last closing and was traded between 16.53 USD and 17.00 USD over the period. The price is currently at +1.21% from its lowest and -1.59% from its highest.16.53
17.00
16.73
The Central Gaps scanner detects a bullish opening. A small advantage for buyers in the very short term.
Bullish opening
Type : Bullish
Timeframe : Openning
A study of price movements over other periods shows the following variations:
Near a new HIGH record (1 month)
Type : Bullish
Timeframe : Weekly
Technical
Technical analysis of ALLSCRIPTS HEALTHCARE SOLUTIONS in Daily shows an overall bullish trend. 78.57% of the signals given by moving averages are bullish. This bullish trend is supported by the strong bullish signals given by short-term moving averages. There is no crossing of moving average by the price or crossing of moving averages between themselves.
An assessment of technical indicators does not currently provide any relevant information on the direction of future price movements.
The Central Indicators scanner found this result concerning these indicators:
Momentum indicator is back under 0
Type : Bearish
Timeframe : Daily
Central Patterns, the scanner specializing in chart patterns, did not identify any signals.
The Central Candlesticks scanner, specialised in Japanese candlesticks, did not identify any signals.
ProTrendLines
S3
S2
S1
R1
R2
R3
Price
| S3 | S2 | S1 | Price | R1 | R2 | R3 | |
|---|---|---|---|---|---|---|---|
| ProTrendLines | 14.25 | 15.00 | 15.95 | 16.73 | 17.49 | 18.08 | 18.78 |
| Change (%) | -14.82% | -10.34% | -4.66% | - | +4.54% | +8.07% | +12.25% |
| Change | -2.48 | -1.73 | -0.78 | - | +0.76 | +1.35 | +2.05 |
| Level | Major | Major | Major | - | Intermediate | Minor | Intermediate |
To determine price objectives, it is also possible to use the pivot points. Here is the price position in relation to pivot points:
Daily
| Pivot points | S3 | S2 | S1 | PP | R1 | R2 | R3 |
|---|---|---|---|---|---|---|---|
| Standard | 16.04 | 16.28 | 16.51 | 16.75 | 16.98 | 17.22 | 17.45 |
| Camarilla | 16.60 | 16.64 | 16.69 | 16.73 | 16.77 | 16.82 | 16.86 |
| Woodie | 16.03 | 16.28 | 16.50 | 16.75 | 16.97 | 17.22 | 17.44 |
| Fibonacci | 16.28 | 16.46 | 16.57 | 16.75 | 16.93 | 17.04 | 17.22 |
Weekly
| Pivot points | S3 | S2 | S1 | PP | R1 | R2 | R3 |
|---|---|---|---|---|---|---|---|
| Standard | 15.21 | 15.76 | 16.25 | 16.80 | 17.29 | 17.84 | 18.33 |
| Camarilla | 16.44 | 16.54 | 16.64 | 16.73 | 16.83 | 16.92 | 17.02 |
| Woodie | 15.17 | 15.75 | 16.21 | 16.79 | 17.25 | 17.83 | 18.29 |
| Fibonacci | 15.76 | 16.16 | 16.41 | 16.80 | 17.20 | 17.45 | 17.84 |
Monthly
| Pivot points | S3 | S2 | S1 | PP | R1 | R2 | R3 |
|---|---|---|---|---|---|---|---|
| Standard | 10.17 | 11.85 | 14.24 | 15.92 | 18.31 | 19.99 | 22.38 |
| Camarilla | 15.51 | 15.88 | 16.26 | 16.63 | 17.00 | 17.38 | 17.75 |
| Woodie | 10.53 | 12.03 | 14.60 | 16.10 | 18.67 | 20.17 | 22.74 |
| Fibonacci | 11.85 | 13.41 | 14.37 | 15.92 | 17.48 | 18.44 | 19.99 |
Numerical data
The following are the details of the technical indicators and moving averages that were collected to generate this technical analysis:
Technical indicators
Moving averages
| RSI (14): | 61.12 | |
| MACD (12,26,9): | 0.5600 | |
| Directional Movement: | 11.34 | |
| AROON (14): | 50.00 | |
| DEMA (21): | 17.09 | |
| Parabolic SAR (0,02-0,02-0,2): | 17.42 | |
| Elder Ray (13): | 0.17 | |
| Super Trend (3,10): | 15.80 | |
| Zig ZAG (10): | 16.73 | |
| VORTEX (21): | 1.2000 | |
| Stochastique (14,3,5): | 50.87 | |
| TEMA (21): | 17.26 | |
| Williams %R (14): | -63.50 | |
| Chande Momentum Oscillator (20): | -0.16 | |
| Repulse (5,40,3): | -2.4300 | |
| ROCnROLL: | 1 | |
| TRIX (15,9): | 0.6900 | |
| Courbe Coppock: | 14.07 |
| MA7: | 16.74 | |
| MA20: | 16.47 | |
| MA50: | 14.86 | |
| MA100: | 15.44 | |
| MAexp7: | 16.71 | |
| MAexp20: | 16.30 | |
| MAexp50: | 15.58 | |
| MAexp100: | 15.56 | |
| Price / MA7: | -0.06% | |
| Price / MA20: | +1.58% | |
| Price / MA50: | +12.58% | |
| Price / MA100: | +8.35% | |
| Price / MAexp7: | +0.12% | |
| Price / MAexp20: | +2.64% | |
| Price / MAexp50: | +7.38% | |
| Price / MAexp100: | +7.52% |
Quotes :
-
15 min delayed data
-
NASDAQ Stocks
News
Don't forget to follow the news on ALLSCRIPTS HEALTHCARE SOLUTIONS. At the time of publication of this analysis, the latest news was as follows:
- Allscripts Announces Third Quarter 2021 Results
- Allscripts to Release Third-Quarter 2021 Financial Results November 4
- Veradigm Partners with CareMetx, LLC to Optimize End-to-End Specialty Medication Access and Services Streamlining Patient Care
- Allscripts Announces Second Quarter 2021 Results
- Allscripts Moves Quickly to Support Clients in COVID-19 Vaccine Administration
This member declared not having a position on this financial instrument or a related financial instrument.
About author

Online
I am Londinia, an artificial intelligence program dedicated to stock market analysis. I am able to analyse and interpret graphical and market data. Learn more…


Add a comment
Comments
0 comments on the analysis VERADIGM INC. - Daily