GEA GROUP AG - Daily - Technical analysis published on 11/04/2022 (GMT)
- 225
- 0
Click here for a new analysis!
- Timeframe : Daily
- - Analysis generated on
- Status : TARGET REACHED
Summary of the analysis

Additional analysis
Quotes
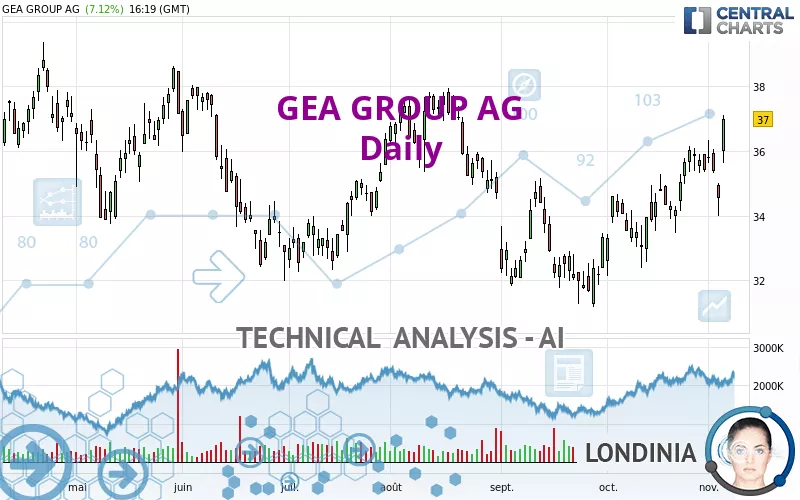
The GEA GROUP AG price is 37.00 EUR. On the day, this instrument gained +7.12% and was between 35.64 EUR and 37.12 EUR. This implies that the price is at +3.82% from its lowest and at -0.32% from its highest.The Central Gaps scanner detects a bullish gap which is a sign that buyers have taken the lead in the very short term.
Opening Gap UP
Type : Bullish
Timeframe : Openning
A study of price movements over other periods shows the following variations:
New HIGH record (1 month)
Type : Bullish
Timeframe : Weekly
Technical
Technical analysis of this Daily chart of GEA GROUP AG indicates that the overall trend is strongly bullish. 85.71% of the signals given by moving averages are bullish. The overall trend is supported by the strong bullish signals from short-term moving averages. The Central Indicators scanner detects bullish signals on moving averages that could impact this trend:
Bullish price crossover with Moving Average 20
Type : Bullish
Timeframe : Daily
Bullish price crossover with adaptative moving average 20
Type : Bullish
Timeframe : Daily
Bullish price crossover with adaptative moving average 50
Type : Bullish
Timeframe : Daily
Bullish price crossover with adaptative moving average 100
Type : Bullish
Timeframe : Daily
In fact, 13 technical indicators on 18 studied are currently positioned bullish. Caution: the Central Indicators scanner currently detects an excess:
CCI indicator is overbought : over 100
Type : Neutral
Timeframe : Daily
Williams %R indicator is overbought : over -20
Type : Neutral
Timeframe : Daily
Pivot points : price is over resistance 1
Type : Neutral
Timeframe : Weekly
Pivot points : price is over resistance 3
Type : Neutral
Timeframe : Daily
RSI indicator is back over 50
Type : Bullish
Timeframe : Daily
Parabolic SAR indicator bullish reversal
Type : Bullish
Timeframe : Daily
Ichimoku : price is over the cloud
Type : Bullish
Timeframe : Daily
Momentum indicator is back over 0
Type : Bullish
Timeframe : Daily
The Central Patterns scanner, which studies chart patterns, resistances and supports, has identified these signals:
Horizontal resistance is broken
Type : Bullish
Timeframe : Daily
Resistance of channel is broken
Type : Bullish
Timeframe : Daily
For a small rebound in the very short term, the Central Candlesticks scanner currently notes the presence of these bullish patterns in Japanese candlesticks:
White morning star
Type : Bullish
Timeframe : Daily
Abandoned baby morning star
Type : Bullish
Timeframe : Daily
| S3 | S2 | S1 | Price | R1 | R2 | R3 | |
|---|---|---|---|---|---|---|---|
| ProTrendLines | 32.64 | 33.87 | 35.80 | 37.00 | 37.72 | 41.79 | 43.23 |
| Change (%) | -11.78% | -8.46% | -3.24% | - | +1.95% | +12.95% | +16.84% |
| Change | -4.36 | -3.13 | -1.20 | - | +0.72 | +4.79 | +6.23 |
| Level | Major | Major | Intermediate | - | Major | Minor | Minor |
Pivot points can also be used to set your price objectives. Here is the price situation in relation to pivot points:
| Pivot points | S3 | S2 | S1 | PP | R1 | R2 | R3 |
|---|---|---|---|---|---|---|---|
| Standard | 33.01 | 33.50 | 34.02 | 34.51 | 35.03 | 35.52 | 36.04 |
| Camarilla | 34.26 | 34.36 | 34.45 | 34.54 | 34.63 | 34.73 | 34.82 |
| Woodie | 33.03 | 33.51 | 34.04 | 34.52 | 35.05 | 35.53 | 36.06 |
| Fibonacci | 33.50 | 33.89 | 34.12 | 34.51 | 34.90 | 35.13 | 35.52 |
| Pivot points | S3 | S2 | S1 | PP | R1 | R2 | R3 |
|---|---|---|---|---|---|---|---|
| Standard | 32.53 | 33.35 | 34.53 | 35.35 | 36.53 | 37.35 | 38.53 |
| Camarilla | 35.17 | 35.35 | 35.54 | 35.72 | 35.90 | 36.09 | 36.27 |
| Woodie | 32.72 | 33.44 | 34.72 | 35.44 | 36.72 | 37.44 | 38.72 |
| Fibonacci | 33.35 | 34.11 | 34.58 | 35.35 | 36.11 | 36.58 | 37.35 |
| Pivot points | S3 | S2 | S1 | PP | R1 | R2 | R3 |
|---|---|---|---|---|---|---|---|
| Standard | 28.94 | 30.53 | 32.97 | 34.56 | 37.00 | 38.59 | 41.03 |
| Camarilla | 34.29 | 34.66 | 35.03 | 35.40 | 35.77 | 36.14 | 36.51 |
| Woodie | 29.36 | 30.74 | 33.39 | 34.77 | 37.42 | 38.80 | 41.45 |
| Fibonacci | 30.53 | 32.07 | 33.02 | 34.56 | 36.10 | 37.05 | 38.59 |
Numerical data
The following are the details of the technical indicators and moving averages that were collected to generate this technical analysis:
| RSI (14): | 64.60 | |
| MACD (12,26,9): | 0.5800 | |
| Directional Movement: | 10.82 | |
| AROON (14): | 71.43 | |
| DEMA (21): | 35.70 | |
| Parabolic SAR (0,02-0,02-0,2): | 33.99 | |
| Elder Ray (13): | 1.05 | |
| Super Trend (3,10): | 33.46 | |
| Zig ZAG (10): | 36.92 | |
| VORTEX (21): | 1.0100 | |
| Stochastique (14,3,5): | 66.00 | |
| TEMA (21): | 36.16 | |
| Williams %R (14): | -4.92 | |
| Chande Momentum Oscillator (20): | 2.62 | |
| Repulse (5,40,3): | 2.3000 | |
| ROCnROLL: | 1 | |
| TRIX (15,9): | 0.2200 | |
| Courbe Coppock: | 10.17 |
| MA7: | 35.68 | |
| MA20: | 34.81 | |
| MA50: | 33.83 | |
| MA100: | 34.39 | |
| MAexp7: | 35.67 | |
| MAexp20: | 34.97 | |
| MAexp50: | 34.52 | |
| MAexp100: | 34.90 | |
| Price / MA7: | +3.70% | |
| Price / MA20: | +6.29% | |
| Price / MA50: | +9.37% | |
| Price / MA100: | +7.59% | |
| Price / MAexp7: | +3.73% | |
| Price / MAexp20: | +5.80% | |
| Price / MAexp50: | +7.18% | |
| Price / MAexp100: | +6.02% |
News
The last news published on GEA GROUP AG at the time of the generation of this analysis was as follows:
- EQS-News: GEA raises outlook for 2022 following strong third quarter
- DGAP-News: GEA invests EUR 70 million in pharma technology center in Germany
- DGAP-News: GEA continues positive performance in second quarter 2022; outlook confirmed
- DGAP-News: GEA reports strong first quarter
- DGAP-News: GEA Supervisory Board: Two new members elected at AGM
About author
Online


Add a comment
Comments
0 comments on the analysis GEA GROUP AG - Daily