GEA GROUP AG overview
GEA GROUP AG
> Analyses

 Thank you
Reply
Chart
Thank you
Reply
Chart
Londinia
has published a new analysis.
- 0
- 91759
- 15637
- 0
Timeframe : Daily - Simple chart
Status : TARGET REACHED
All elements being clearly bullish, it would be possible for traders to trade only long positions (at the time of purchase) on GEA GROUP AG as long as the price remains well above 49.38 EUR. The…
GEA GROUP AG
> Analyses
 Thank you
Reply
Chart
Thank you
Reply
Chart
Londinia
has published a new analysis.
- 0
- 91759
- 15637
- 0
Timeframe : 1H - Simple chart
Status : LEVEL MAINTAINED
The strong short-term decline in GEA GROUP AG calls into question the currently slightly bullish basic trend. A trend reversal is likely. As long as the price remains below the resistance located at…
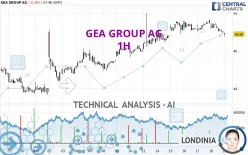
GEA GROUP AG
> Analyses
 Thank you
Reply
Chart
Thank you
Reply
Chart
Londinia
has published a new analysis.
- 0
- 91759
- 15637
- 0
Timeframe : 1H - Simple chart
Status : TARGET REACHED
GEA GROUP AG is part of a very strong bullish trend. Traders may consider trading only long positions (at the time of purchase) as long as the price remains well above 46.28 EUR. The next resistance…

