INPOST - Daily - Technical analysis published on 10/23/2023 (GMT)
- 170
- 0
Click here for a new analysis!
- Timeframe : Daily
- - Analysis generated on
- Status : INVALID

Summary of the analysis

Additional analysis
Quotes
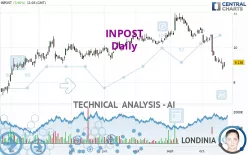
The INPOST rating is 9.138 EUR. On the day, this instrument gained +3.96% with the lowest point at 8.882 EUR and the highest point at 9.164 EUR. The deviation from the price is +2.88% for the low point and -0.28% for the high point.The Central Gaps scanner detects a bullish opening. A small advantage for buyers in the very short term.
Bullish opening
Type : Bullish
Timeframe : Openning
Here is a more detailed summary of the historical variations registered by INPOST:
Near a new LOW record (1 month)
Type : Bearish
Timeframe : Weekly
Technical
Technical analysis of this Daily chart of INPOST indicates that the overall trend is strongly bearish. 85.71% of the signals given by moving averages are bearish. This strongly bearish trend is supported by the strong bearish signals given by short-term moving averages. There is no crossing of moving average by the price or crossing of moving averages between themselves.
The probability of a further decline is low given the direction of the technical indicators.
Caution: the Central Indicators scanner currently detects an excess:
CCI indicator: bullish divergence
Type : Bullish
Timeframe : Daily
Pivot points : price is over resistance 1
Type : Neutral
Timeframe : Daily
Price is back over the pivot point
Type : Bullish
Timeframe : Weekly
Central Patterns, the market scanner focusing on chart patterns, resistances and supports found this result:
Near support of channel
Type : Bullish
Timeframe : Daily
The Central Candlesticks scanner which studies Japanese candlesticks did not detect anything.
| S3 | S2 | S1 | Price | R1 | R2 | R3 | |
|---|---|---|---|---|---|---|---|
| ProTrendLines | 7.375 | 8.056 | 8.640 | 9.138 | 9.148 | 10.315 | 10.870 |
| Change (%) | -19.29% | -11.84% | -5.45% | - | +0.11% | +12.88% | +18.95% |
| Change | -1.763 | -1.082 | -0.498 | - | +0.010 | +1.177 | +1.732 |
| Level | Major | Minor | Intermediate | - | Major | Major | Intermediate |
Pivot points can also be used to set your price objectives. Here is the price situation in relation to pivot points:
| Pivot points | S3 | S2 | S1 | PP | R1 | R2 | R3 |
|---|---|---|---|---|---|---|---|
| Standard | 8.195 | 8.451 | 8.621 | 8.877 | 9.047 | 9.303 | 9.473 |
| Camarilla | 8.673 | 8.712 | 8.751 | 8.790 | 8.829 | 8.868 | 8.907 |
| Woodie | 8.151 | 8.430 | 8.577 | 8.856 | 9.003 | 9.282 | 9.429 |
| Fibonacci | 8.451 | 8.614 | 8.715 | 8.877 | 9.040 | 9.141 | 9.303 |
| Pivot points | S3 | S2 | S1 | PP | R1 | R2 | R3 |
|---|---|---|---|---|---|---|---|
| Standard | 7.816 | 8.262 | 8.526 | 8.972 | 9.236 | 9.682 | 9.946 |
| Camarilla | 8.595 | 8.660 | 8.725 | 8.790 | 8.855 | 8.920 | 8.985 |
| Woodie | 7.725 | 8.217 | 8.435 | 8.927 | 9.145 | 9.637 | 9.855 |
| Fibonacci | 8.262 | 8.533 | 8.701 | 8.972 | 9.243 | 9.411 | 9.682 |
| Pivot points | S3 | S2 | S1 | PP | R1 | R2 | R3 |
|---|---|---|---|---|---|---|---|
| Standard | 8.842 | 9.663 | 10.332 | 11.153 | 11.822 | 12.643 | 13.312 |
| Camarilla | 10.590 | 10.727 | 10.863 | 11.000 | 11.137 | 11.273 | 11.410 |
| Woodie | 8.765 | 9.625 | 10.255 | 11.115 | 11.745 | 12.605 | 13.235 |
| Fibonacci | 9.663 | 10.233 | 10.584 | 11.153 | 11.723 | 12.074 | 12.643 |
Numerical data
The following is the status of the technical indicators and moving averages at the time of publication of this technical analysis:
| RSI (14): | 32.06 | |
| MACD (12,26,9): | -0.4860 | |
| Directional Movement: | -27.543 | |
| AROON (14): | -57.143 | |
| DEMA (21): | 9.246 | |
| Parabolic SAR (0,02-0,02-0,2): | 9.498 | |
| Elder Ray (13): | -0.519 | |
| Super Trend (3,10): | 9.917 | |
| Zig ZAG (10): | 9.138 | |
| VORTEX (21): | 0.7390 | |
| Stochastique (14,3,5): | 8.36 | |
| TEMA (21): | 8.871 | |
| Williams %R (14): | -79.10 | |
| Chande Momentum Oscillator (20): | -1.247 | |
| Repulse (5,40,3): | -1.3330 | |
| ROCnROLL: | 2 | |
| TRIX (15,9): | -0.5040 | |
| Courbe Coppock: | 27.94 |
| MA7: | 9.127 | |
| MA20: | 10.018 | |
| MA50: | 10.527 | |
| MA100: | 10.265 | |
| MAexp7: | 9.229 | |
| MAexp20: | 9.820 | |
| MAexp50: | 10.234 | |
| MAexp100: | 10.117 | |
| Price / MA7: | +0.12% | |
| Price / MA20: | -8.78% | |
| Price / MA50: | -13.19% | |
| Price / MA100: | -10.98% | |
| Price / MAexp7: | -0.99% | |
| Price / MAexp20: | -6.95% | |
| Price / MAexp50: | -10.71% | |
| Price / MAexp100: | -9.68% |
News
Don't forget to follow the news on INPOST. At the time of publication of this analysis, the latest news was as follows:
- InPost Group, Vinted launch European ecommerce delivery partnership
- InPost completes acquisition of Mondial Relay to create Europe's leading out-of-home solution for e-commerce
- Private Debt Investors Doubt Their Ability To Handle Defaults in a Post Pandemic Downturn - a Report Commissioned by Ocorian
- DHL Express: Robust e-commerce growth and rise of millennials, means delivery firms must step up their game in the post COVID-19 era
About author
Online


Add a comment
Comments
0 comments on the analysis INPOST - Daily