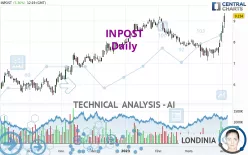
INPOST - Daily - Technical analysis published on 04/04/2023 (GMT)
- 206
- 0
Click here for a new analysis!
- Timeframe : Daily
- - Analysis generated on
- Status : LEVEL MAINTAINED

Summary of the analysis

Additional analysis
Quotes
INPOST rating 9.234 EUR. The price has increased by +5.36% since the last closing and was between 8.662 EUR and 9.368 EUR. This implies that the price is at +6.60% from its lowest and at -1.43% from its highest.The Central Gaps scanner detects a bullish opening. A small advantage for buyers in the very short term.
Bullish opening
Type : Bullish
Timeframe : Openning
Here is a more detailed summary of the historical variations registered by INPOST:
New HIGH record (1 year)
Type : Bullish
Timeframe : Weekly
New HIGH record (1st january)
Type : Bullish
Timeframe : Weekly
New HIGH record (1 month)
Type : Bullish
Timeframe : Weekly
Technical
A technical analysis in Daily of this INPOST chart shows a strongly bullish trend. The signals given by the moving averages are 85.71% bullish. This strong bullish trend is confirmed by the strong signals currently being given by short-term moving averages. The Central Indicators market scanner currently does not detect any result that concerns moving averages.
In fact, 16 technical indicators on 18 studied are currently bullish. But beware of excesses. The Central Indicators scanner currently detects this:
RSI indicator is overbought : over 70
Type : Neutral
Timeframe : Daily
CCI indicator is overbought : over 100
Type : Neutral
Timeframe : Daily
Previous candle closed over Bollinger bands
Type : Neutral
Timeframe : Daily
Williams %R indicator is overbought : over -20
Type : Neutral
Timeframe : Daily
Pivot points : price is over resistance 1
Type : Neutral
Timeframe : Weekly
Pivot points : price is over resistance 2
Type : Neutral
Timeframe : Daily
An analysis of the price chart with the Central Patterns scanner (detector of chart patterns and resistances and supports) shows several results that can have an impact on the price change:
Near horizontal resistance
Type : Bearish
Timeframe : Daily
Resistance of channel is broken
Type : Bullish
Timeframe : Daily
No result was found by the Central Candlesticks scanner on Japanese candlesticks.
| S3 | S2 | S1 | Price | R1 | R2 | R3 | |
|---|---|---|---|---|---|---|---|
| ProTrendLines | 7.361 | 8.640 | 9.148 | 9.234 | 10.834 | 13.572 | 17.786 |
| Change (%) | -20.28% | -6.43% | -0.93% | - | +17.33% | +46.98% | +92.61% |
| Change | -1.873 | -0.594 | -0.086 | - | +1.600 | +4.338 | +8.552 |
| Level | Major | Minor | Major | - | Minor | Intermediate | Intermediate |
Pivot points can also be used to set your price objectives. Here is the price situation in relation to pivot points:
| Pivot points | S3 | S2 | S1 | PP | R1 | R2 | R3 |
|---|---|---|---|---|---|---|---|
| Standard | 7.973 | 8.201 | 8.483 | 8.711 | 8.993 | 9.221 | 9.503 |
| Camarilla | 8.624 | 8.671 | 8.717 | 8.764 | 8.811 | 8.858 | 8.904 |
| Woodie | 7.999 | 8.215 | 8.509 | 8.725 | 9.019 | 9.235 | 9.529 |
| Fibonacci | 8.201 | 8.396 | 8.517 | 8.711 | 8.906 | 9.027 | 9.221 |
| Pivot points | S3 | S2 | S1 | PP | R1 | R2 | R3 |
|---|---|---|---|---|---|---|---|
| Standard | 6.518 | 6.940 | 7.676 | 8.098 | 8.834 | 9.256 | 9.992 |
| Camarilla | 8.094 | 8.200 | 8.306 | 8.412 | 8.518 | 8.624 | 8.731 |
| Woodie | 6.675 | 7.019 | 7.833 | 8.177 | 8.991 | 9.335 | 10.149 |
| Fibonacci | 6.940 | 7.382 | 7.656 | 8.098 | 8.540 | 8.814 | 9.256 |
| Pivot points | S3 | S2 | S1 | PP | R1 | R2 | R3 |
|---|---|---|---|---|---|---|---|
| Standard | 6.111 | 6.615 | 7.513 | 8.017 | 8.915 | 9.419 | 10.317 |
| Camarilla | 8.027 | 8.155 | 8.284 | 8.412 | 8.541 | 8.669 | 8.798 |
| Woodie | 6.309 | 6.714 | 7.711 | 8.116 | 9.113 | 9.518 | 10.515 |
| Fibonacci | 6.615 | 7.150 | 7.481 | 8.017 | 8.552 | 8.883 | 9.419 |
Numerical data
The following is the status of technical indicators and moving averages registered at the time this technical analysis was created:
| RSI (14): | 74.99 | |
| MACD (12,26,9): | 0.1450 | |
| Directional Movement: | 17.605 | |
| AROON (14): | 78.571 | |
| DEMA (21): | 8.114 | |
| Parabolic SAR (0,02-0,02-0,2): | 7.576 | |
| Elder Ray (13): | 0.898 | |
| Super Trend (3,10): | 7.903 | |
| Zig ZAG (10): | 9.236 | |
| VORTEX (21): | 1.0860 | |
| Stochastique (14,3,5): | 92.26 | |
| TEMA (21): | 8.360 | |
| Williams %R (14): | -5.87 | |
| Chande Momentum Oscillator (20): | 1.860 | |
| Repulse (5,40,3): | 11.4310 | |
| ROCnROLL: | 1 | |
| TRIX (15,9): | -0.1260 | |
| Courbe Coppock: | 16.14 |
| MA7: | 8.183 | |
| MA20: | 7.827 | |
| MA50: | 8.140 | |
| MA100: | 7.971 | |
| MAexp7: | 8.385 | |
| MAexp20: | 8.019 | |
| MAexp50: | 7.994 | |
| MAexp100: | 7.774 | |
| Price / MA7: | +12.84% | |
| Price / MA20: | +17.98% | |
| Price / MA50: | +13.44% | |
| Price / MA100: | +15.84% | |
| Price / MAexp7: | +10.13% | |
| Price / MAexp20: | +15.15% | |
| Price / MAexp50: | +15.51% | |
| Price / MAexp100: | +18.78% |
News
The last news published on INPOST at the time of the generation of this analysis was as follows:
- InPost Group, Vinted launch European ecommerce delivery partnership
- InPost completes acquisition of Mondial Relay to create Europe's leading out-of-home solution for e-commerce
- Private Debt Investors Doubt Their Ability To Handle Defaults in a Post Pandemic Downturn - a Report Commissioned by Ocorian
- DHL Express: Robust e-commerce growth and rise of millennials, means delivery firms must step up their game in the post COVID-19 era
About author
Online


Add a comment
Comments
0 comments on the analysis INPOST - Daily