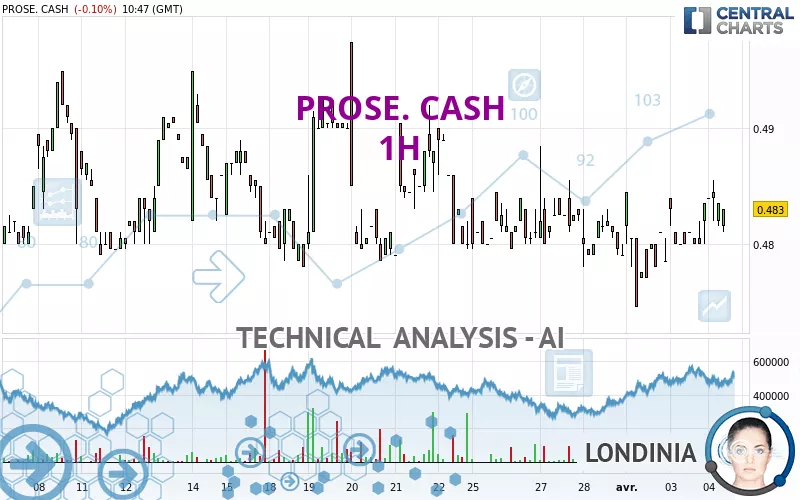
PROSE. CASH - 1H - Technical analysis published on 04/04/2024 (GMT)
- 114
- 0
Click here for a new analysis!
- Timeframe : 1H
- - Analysis generated on
- Status : TARGET REACHED
Summary of the analysis

Additional analysis
Quotes
The PROSE. CASH price is 0.4830 EUR. The price is lower by -0.10% since the last closing and was traded between 0.4810 EUR and 0.4855 EUR over the period. The price is currently at +0.42% from its lowest and -0.51% from its highest.The Central Gaps scanner detects a bullish opening marking the presence of buyers ahead of sellers at the opening but not sufficiently marked to allow the price to register a quotation gap.
Bullish opening
Type : Bullish
Timeframe : Openning
A study of price movements over other periods shows the following variations:
Near a new LOW record (5 years)
Type : Bearish
Timeframe : Weekly
Near a new HIGH record (1 month)
Type : Bullish
Timeframe : Weekly
Technical
A technical analysis in 1H of this PROSE. CASH chart shows a slightly bullish trend. 60.71% of the signals given by moving averages are bullish. The slightly bullish signals given by short-term moving averages do not show a strengthening of this global trend. The Central Indicators scanner detects bearish signals on moving averages that could impact this trend:
Bearish price crossover with adaptative moving average 50
Type : Bearish
Timeframe : 1 hour
Bearish price crossover with adaptative moving average 100
Type : Bearish
Timeframe : 1 hour
In fact, 12 technical indicators on 18 studied are currently bullish. Central Indicators, the scanner specialised in technical indicators, has identified these signals:
Price is back over the pivot point
Type : Bullish
Timeframe : 1 hour
Price is back over the pivot point
Type : Bullish
Timeframe : Weekly
The Central Patterns scanner, which studies chart patterns, resistances and supports, has identified this signal:
Near resistance of channel
Type : Bearish
Timeframe : 1 hour
No result was found by the Central Candlesticks scanner on Japanese candlesticks.
| S3 | S2 | S1 | Price | R1 | R2 | R3 | |
|---|---|---|---|---|---|---|---|
| ProTrendLines | 0.4720 | 0.4745 | 0.4780 | 0.4830 | 0.4840 | 0.4885 | 0.4920 |
| Change (%) | -2.28% | -1.76% | -1.04% | - | +0.21% | +1.14% | +1.86% |
| Change | -0.0110 | -0.0085 | -0.0050 | - | +0.0010 | +0.0055 | +0.0090 |
| Level | Intermediate | Minor | Intermediate | - | Intermediate | Minor | Minor |
Attention could also be paid to pivot points to set price objectives:
| Pivot points | S3 | S2 | S1 | PP | R1 | R2 | R3 |
|---|---|---|---|---|---|---|---|
| Standard | 0.4770 | 0.4785 | 0.4810 | 0.4825 | 0.4850 | 0.4865 | 0.4890 |
| Camarilla | 0.4824 | 0.4828 | 0.4831 | 0.4835 | 0.4839 | 0.4842 | 0.4846 |
| Woodie | 0.4775 | 0.4788 | 0.4815 | 0.4828 | 0.4855 | 0.4868 | 0.4895 |
| Fibonacci | 0.4785 | 0.4800 | 0.4810 | 0.4825 | 0.4840 | 0.4850 | 0.4865 |
| Pivot points | S3 | S2 | S1 | PP | R1 | R2 | R3 |
|---|---|---|---|---|---|---|---|
| Standard | 0.4647 | 0.4713 | 0.4752 | 0.4818 | 0.4857 | 0.4923 | 0.4962 |
| Camarilla | 0.4761 | 0.4771 | 0.4780 | 0.4790 | 0.4800 | 0.4809 | 0.4819 |
| Woodie | 0.4633 | 0.4706 | 0.4738 | 0.4811 | 0.4843 | 0.4916 | 0.4948 |
| Fibonacci | 0.4713 | 0.4753 | 0.4778 | 0.4818 | 0.4858 | 0.4883 | 0.4923 |
| Pivot points | S3 | S2 | S1 | PP | R1 | R2 | R3 |
|---|---|---|---|---|---|---|---|
| Standard | 0.4427 | 0.4573 | 0.4682 | 0.4828 | 0.4937 | 0.5083 | 0.5192 |
| Camarilla | 0.4720 | 0.4743 | 0.4767 | 0.4790 | 0.4813 | 0.4837 | 0.4860 |
| Woodie | 0.4408 | 0.4564 | 0.4663 | 0.4819 | 0.4918 | 0.5074 | 0.5173 |
| Fibonacci | 0.4573 | 0.4671 | 0.4731 | 0.4828 | 0.4926 | 0.4986 | 0.5083 |
Numerical data
The following is the status of technical indicators and moving averages registered at the time this technical analysis was created:
| RSI (14): | 54.15 | |
| MACD (12,26,9): | 0.0007 | |
| Directional Movement: | 1.4336 | |
| AROON (14): | 85.7143 | |
| DEMA (21): | 0.4822 | |
| Parabolic SAR (0,02-0,02-0,2): | 0.4768 | |
| Elder Ray (13): | 0 | |
| Super Trend (3,10): | 0.4854 | |
| Zig ZAG (10): | 0.4830 | |
| VORTEX (21): | 0.7190 | |
| Stochastique (14,3,5): | 74.76 | |
| TEMA (21): | 0.4832 | |
| Williams %R (14): | -35.71 | |
| Chande Momentum Oscillator (20): | 0.0045 | |
| Repulse (5,40,3): | 0.9835 | |
| ROCnROLL: | 1 | |
| TRIX (15,9): | 0.0064 | |
| Courbe Coppock: | 1.53 |
| MA7: | 0.4811 | |
| MA20: | 0.4825 | |
| MA50: | 0.4818 | |
| MA100: | 0.5046 | |
| MAexp7: | 0.4828 | |
| MAexp20: | 0.4815 | |
| MAexp50: | 0.4814 | |
| MAexp100: | 0.4820 | |
| Price / MA7: | +0.39% | |
| Price / MA20: | +0.10% | |
| Price / MA50: | +0.25% | |
| Price / MA100: | -4.28% | |
| Price / MAexp7: | +0.04% | |
| Price / MAexp20: | +0.31% | |
| Price / MAexp50: | +0.33% | |
| Price / MAexp100: | +0.21% |
About author
Online


Add a comment
Comments
0 comments on the analysis PROSE. CASH - 1H