FUCHS SEVZO NA O.N. - Daily - Technical analysis published on 10/09/2019 (GMT)
- 257
- 0
- Who voted?
Click here for a new analysis!
- Timeframe : Daily
- - Analysis generated on
- Status : INVALID
Summary of the analysis

Additional analysis
Quotes
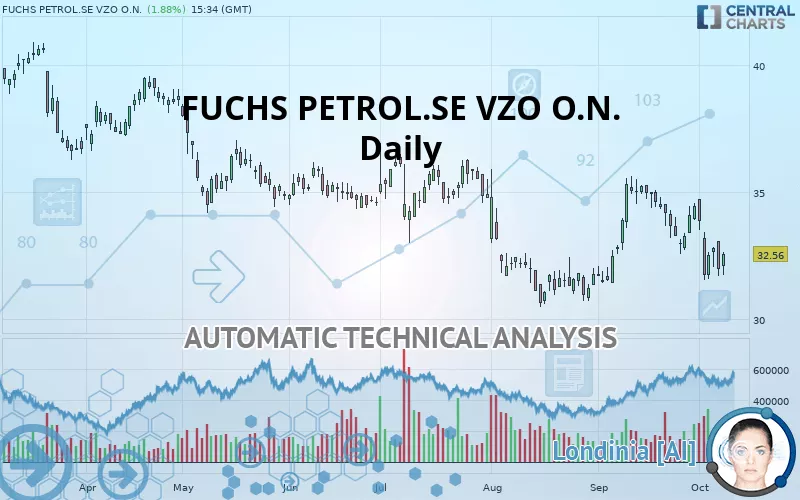
The FUCHS PETROL.SE VZO O.N. rating is 32.56 EUR. On the day, this instrument gained +1.88% and was traded between 31.72 EUR and 32.64 EUR over the period. The price is currently at +2.65% from its lowest and -0.25% from its highest.Here is a more detailed summary of the historical variations registered by FUCHS PETROL.SE VZO O.N.:
Near a new LOW record (1 year)
Type : Bearish
Timeframe : Weekly
Near a new LOW record (1st january)
Type : Bearish
Timeframe : Weekly
Near a new LOW record (1 month)
Type : Bearish
Timeframe : Weekly
Technical
A technical analysis in Daily of this FUCHS PETROL.SE VZO O.N. chart shows a sharp bearish trend. 89.29% of the signals given by moving averages are bearish. The overall trend is supported by the strong bearish signals from short-term moving averages. There is no crossing of moving average by the price or crossing of moving averages between themselves.
In fact, 10 technical indicators on 18 studied are currently positioned bearish. Caution: the Central Indicators scanner currently detects an excess:
CCI indicator is oversold : under -100
Type : Neutral
Timeframe : Daily
Williams %R indicator is oversold : under -80
Type : Neutral
Timeframe : Daily
Ichimoku : price is under the cloud
Type : Bearish
Timeframe : Daily
Price is back under the pivot point
Type : Bearish
Timeframe : Daily
Price is back under the pivot point
Type : Bearish
Timeframe : Weekly
The Central Patterns scanner, which studies chart patterns, resistances and supports, has identified these signals:
Near horizontal support
Type : Bullish
Timeframe : Daily
Support of channel is broken
Type : Bearish
Timeframe : Daily
The presence of a bearish pattern in Japanese candlesticks detected by Central Candlesticks that could cause a correction in the very short term was also detected:
Bearish engulfing lines
Type : Bearish
Timeframe : Daily
| S3 | S2 | S1 | Price | R1 | R2 | R3 | |
|---|---|---|---|---|---|---|---|
| ProTrendLines | 26.75 | 30.62 | 31.79 | 32.56 | 34.03 | 36.58 | 39.46 |
| Change (%) | -17.84% | -5.96% | -2.36% | - | +4.51% | +12.35% | +21.19% |
| Change | -5.81 | -1.94 | -0.77 | - | +1.47 | +4.02 | +6.90 |
| Level | Minor | Major | Intermediate | - | Major | Minor | Minor |
To determine price objectives, it is also possible to use the pivot points. Here is the price position in relation to pivot points:
| Pivot points | S3 | S2 | S1 | PP | R1 | R2 | R3 |
|---|---|---|---|---|---|---|---|
| Standard | 30.03 | 30.87 | 31.41 | 32.25 | 32.79 | 33.63 | 34.17 |
| Camarilla | 31.58 | 31.71 | 31.83 | 31.96 | 32.09 | 32.21 | 32.34 |
| Woodie | 29.89 | 30.80 | 31.27 | 32.18 | 32.65 | 33.56 | 34.03 |
| Fibonacci | 30.87 | 31.39 | 31.72 | 32.25 | 32.77 | 33.10 | 33.63 |
| Pivot points | S3 | S2 | S1 | PP | R1 | R2 | R3 |
|---|---|---|---|---|---|---|---|
| Standard | 27.93 | 29.73 | 31.13 | 32.93 | 34.33 | 36.13 | 37.53 |
| Camarilla | 31.64 | 31.93 | 32.23 | 32.52 | 32.81 | 33.11 | 33.40 |
| Woodie | 27.72 | 29.63 | 30.92 | 32.83 | 34.12 | 36.03 | 37.32 |
| Fibonacci | 29.73 | 30.96 | 31.71 | 32.93 | 34.16 | 34.91 | 36.13 |
| Pivot points | S3 | S2 | S1 | PP | R1 | R2 | R3 |
|---|---|---|---|---|---|---|---|
| Standard | 27.81 | 29.61 | 32.03 | 33.83 | 36.25 | 38.05 | 40.47 |
| Camarilla | 33.30 | 33.69 | 34.07 | 34.46 | 34.85 | 35.23 | 35.62 |
| Woodie | 28.13 | 29.77 | 32.35 | 33.99 | 36.57 | 38.21 | 40.79 |
| Fibonacci | 29.61 | 31.22 | 32.22 | 33.83 | 35.44 | 36.44 | 38.05 |
Numerical data
The following is the status of the technical indicators and moving averages at the time of publication of this technical analysis:
| RSI (14): | 45.55 | |
| MACD (12,26,9): | -0.2000 | |
| Directional Movement: | -10.80 | |
| AROON (14): | -71.43 | |
| DEMA (21): | 33.03 | |
| Parabolic SAR (0,02-0,02-0,2): | 34.03 | |
| Elder Ray (13): | -0.87 | |
| Super Trend (3,10): | 35.08 | |
| Zig ZAG (10): | 32.56 | |
| VORTEX (21): | 0.9300 | |
| Stochastique (14,3,5): | 26.27 | |
| TEMA (21): | 32.79 | |
| Williams %R (14): | -68.90 | |
| Chande Momentum Oscillator (20): | -1.62 | |
| Repulse (5,40,3): | 0.3000 | |
| ROCnROLL: | 2 | |
| TRIX (15,9): | 0.0400 | |
| Courbe Coppock: | 10.76 |
| MA7: | 32.84 | |
| MA20: | 33.78 | |
| MA50: | 32.81 | |
| MA100: | 34.03 | |
| MAexp7: | 32.73 | |
| MAexp20: | 33.17 | |
| MAexp50: | 33.40 | |
| MAexp100: | 34.25 | |
| Price / MA7: | -0.85% | |
| Price / MA20: | -3.61% | |
| Price / MA50: | -0.76% | |
| Price / MA100: | -4.32% | |
| Price / MAexp7: | -0.52% | |
| Price / MAexp20: | -1.84% | |
| Price / MAexp50: | -2.51% | |
| Price / MAexp100: | -4.93% |
News
Don"t forget to follow the news on FUCHS PETROL.SE VZO O.N.. At the time of publication of this analysis, the latest news was as follows:
- DGAP-News: FUCHS becomes official lubricants partner of the DMG MORI Qualified Products Program (DMQP)
- DGAP-News: FUCHS opens new plant in Izmir, Turkey
- DGAP-News: FUCHS posts slight decrease in sales revenues of 1% and decline in earnings of 19% in the first half of the year - investment initiative will be continued
- DGAP-Adhoc: FUCHS PETROLUB with decline in sales and earnings in the first half of 2019 - Recovery in the second half of 2019 not visible
- DGAP-News: FUCHS generates sales revenues on the level of the previous year in the first quarter - growth initiative results in costs increasing as planned
About author

Online


Add a comment
Comments
0 comments on the analysis FUCHS SEVZO NA O.N. - Daily