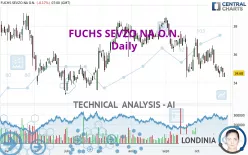
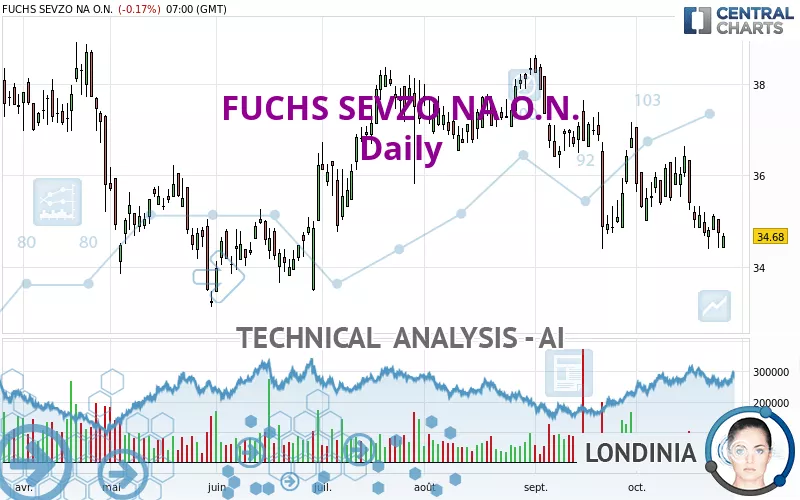
FUCHS SEVZO NA O.N. - Daily - Technical analysis published on 10/26/2023 (GMT)
- 158
- 0
Click here for a new analysis!
- Timeframe : Daily
- - Analysis generated on
- Status : INVALID
Summary of the analysis

Additional analysis
Quotes
The FUCHS SEVZO NA O.N. price is 34.68 EUR. The price registered a decrease of -0.17% on the session with the lowest point at 34.42 EUR and the highest point at 34.74 EUR. The deviation from the price is +0.76% for the low point and -0.17% for the high point.The Central Gaps scanner detects a bearish opening marking the presence of sellers ahead of buyers at the opening but not sufficiently marked to allow the price to register a quotation gap.
Bearish opening
Type : Bearish
Timeframe : Openning
Here is a more detailed summary of the historical variations registered by FUCHS SEVZO NA O.N.:
Near a new LOW record (1 month)
Type : Bearish
Timeframe : Weekly
Technical
Technical analysis of this Daily chart of FUCHS SEVZO NA O.N. indicates that the overall trend is bearish. 78.57% of the signals given by moving averages are bearish. This bearish trend is supported by the strong bearish signals given by short-term moving averages. The Central Indicators market scanner currently does not detect any result that concerns moving averages.
The probability of a further decline is moderate given the direction of the technical indicators.
Caution: the Central Indicators scanner currently detects an excess:
CCI indicator is oversold : under -100
Type : Neutral
Timeframe : Daily
Williams %R indicator is oversold : under -80
Type : Neutral
Timeframe : Daily
Pivot points : price is under support 1
Type : Neutral
Timeframe : Daily
Central Patterns, the market scanner focusing on chart patterns, resistances and supports found this result:
Near horizontal resistance
Type : Bearish
Timeframe : Daily
The Central Candlesticks scanner which studies Japanese candlesticks did not detect anything.
| S3 | S2 | S1 | Price | R1 | R2 | R3 | |
|---|---|---|---|---|---|---|---|
| ProTrendLines | 32.04 | 33.20 | 34.00 | 34.68 | 34.88 | 35.84 | 36.41 |
| Change (%) | -7.61% | -4.27% | -1.96% | - | +0.58% | +3.34% | +4.99% |
| Change | -2.64 | -1.48 | -0.68 | - | +0.20 | +1.16 | +1.73 |
| Level | Major | Intermediate | Minor | - | Intermediate | Minor | Minor |
Pivot points can also be used to set your price objectives. Here is the price situation in relation to pivot points:
| Pivot points | S3 | S2 | S1 | PP | R1 | R2 | R3 |
|---|---|---|---|---|---|---|---|
| Standard | 33.81 | 34.11 | 34.43 | 34.73 | 35.05 | 35.35 | 35.67 |
| Camarilla | 34.57 | 34.63 | 34.68 | 34.74 | 34.80 | 34.85 | 34.91 |
| Woodie | 33.81 | 34.12 | 34.43 | 34.74 | 35.05 | 35.36 | 35.67 |
| Fibonacci | 34.11 | 34.35 | 34.50 | 34.73 | 34.97 | 35.12 | 35.35 |
| Pivot points | S3 | S2 | S1 | PP | R1 | R2 | R3 |
|---|---|---|---|---|---|---|---|
| Standard | 32.11 | 33.39 | 34.07 | 35.35 | 36.03 | 37.31 | 37.99 |
| Camarilla | 34.20 | 34.38 | 34.56 | 34.74 | 34.92 | 35.10 | 35.28 |
| Woodie | 31.80 | 33.24 | 33.76 | 35.20 | 35.72 | 37.16 | 37.68 |
| Fibonacci | 33.39 | 34.14 | 34.61 | 35.35 | 36.10 | 36.57 | 37.31 |
| Pivot points | S3 | S2 | S1 | PP | R1 | R2 | R3 |
|---|---|---|---|---|---|---|---|
| Standard | 30.36 | 32.38 | 34.60 | 36.62 | 38.84 | 40.86 | 43.08 |
| Camarilla | 35.65 | 36.04 | 36.43 | 36.82 | 37.21 | 37.60 | 37.99 |
| Woodie | 30.46 | 32.43 | 34.70 | 36.67 | 38.94 | 40.91 | 43.18 |
| Fibonacci | 32.38 | 34.00 | 35.00 | 36.62 | 38.24 | 39.24 | 40.86 |
Numerical data
The following is the status of the technical indicators and moving averages at the time of publication of this technical analysis:
| RSI (14): | 41.04 | |
| MACD (12,26,9): | -0.3900 | |
| Directional Movement: | -13.60 | |
| AROON (14): | -35.71 | |
| DEMA (21): | 35.00 | |
| Parabolic SAR (0,02-0,02-0,2): | 36.42 | |
| Elder Ray (13): | -0.56 | |
| Super Trend (3,10): | 36.74 | |
| Zig ZAG (10): | 34.74 | |
| VORTEX (21): | 0.8900 | |
| Stochastique (14,3,5): | 21.73 | |
| TEMA (21): | 34.88 | |
| Williams %R (14): | -84.82 | |
| Chande Momentum Oscillator (20): | -0.66 | |
| Repulse (5,40,3): | 0.1100 | |
| ROCnROLL: | 2 | |
| TRIX (15,9): | -0.1300 | |
| Courbe Coppock: | 3.59 |
| MA7: | 34.99 | |
| MA20: | 35.59 | |
| MA50: | 36.40 | |
| MA100: | 36.30 | |
| MAexp7: | 35.07 | |
| MAexp20: | 35.49 | |
| MAexp50: | 36.01 | |
| MAexp100: | 36.07 | |
| Price / MA7: | -0.89% | |
| Price / MA20: | -2.56% | |
| Price / MA50: | -4.73% | |
| Price / MA100: | -4.46% | |
| Price / MAexp7: | -1.11% | |
| Price / MAexp20: | -2.28% | |
| Price / MAexp50: | -3.69% | |
| Price / MAexp100: | -3.85% |
News
The last news published on FUCHS SEVZO NA O.N. at the time of the generation of this analysis was as follows:
- EQS-News: Awarded as a pioneer for climate strategies: FUCHS SE receives Global Transition Award
- EQS-News: FUCHS opens new, state-of-the-art plant in Ba Ria-Vung Tau, Vietnam
- EQS-News: FUCHS further intensifies activities in South America and takes over 100% of FUCHS LUBRICANTS SpA in Chile
- EQS-News: FUCHS successfully concludes first half-year
- Hidden champion steps into the global limelight – How FUCHS lubrication solutions are moving the world
About author
Online


Add a comment
Comments
0 comments on the analysis FUCHS SEVZO NA O.N. - Daily