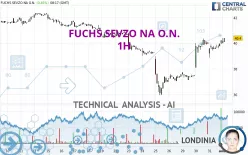
FUCHS SEVZO NA O.N. - 1H - Technical analysis published on 08/01/2024 (GMT)
- 160
- 0
Click here for a new analysis!
- Timeframe : 1H
- - Analysis generated on
- Status : INVALID

Summary of the analysis

Additional analysis
Quotes
The FUCHS SEVZO NA O.N. price is 40.20 EUR. The price registered a decrease of -0.05% on the session and was traded between 40.02 EUR and 40.40 EUR over the period. The price is currently at +0.45% from its lowest and -0.50% from its highest.The Central Gaps scanner detects a bearish opening marking the presence of sellers ahead of buyers at the opening but not sufficiently marked to allow the price to register a quotation gap.
Bearish opening
Type : Bearish
Timeframe : Openning
A study of price movements over other periods shows the following variations:
Technical
Technical analysis of FUCHS SEVZO NA O.N. in 1H shows an overall bullish trend. 75.00% of the signals given by moving averages are bullish. This bullish trend is supported by the strong bullish signals given by short-term moving averages. There is no crossing of moving average by the price or crossing of moving averages between themselves.
In fact, 10 technical indicators on 18 studied are currently bullish. But beware of excesses. The Central Indicators scanner currently detects this:
CCI indicator is overbought : over 100
Type : Neutral
Timeframe : 1 hour
Williams %R indicator is overbought : over -20
Type : Neutral
Timeframe : 1 hour
Price is back over the pivot point
Type : Bullish
Timeframe : Weekly
An analysis of the price chart with the Central Patterns scanner (detector of chart patterns and resistances and supports) shows several results that can have an impact on the price change:
Near horizontal resistance
Type : Bearish
Timeframe : 1 hour
Near resistance of channel
Type : Bearish
Timeframe : 1 hour
The Central Candlesticks scanner which studies Japanese candlesticks did not detect anything.
| S3 | S2 | S1 | Price | R1 | R2 | R3 | |
|---|---|---|---|---|---|---|---|
| ProTrendLines | 37.11 | 38.40 | 39.46 | 40.20 | 40.37 | 41.40 | 42.18 |
| Change (%) | -7.69% | -4.48% | -1.84% | - | +0.42% | +2.99% | +4.93% |
| Change | -3.09 | -1.80 | -0.74 | - | +0.17 | +1.20 | +1.98 |
| Level | Major | Major | Minor | - | Major | Minor | Major |
Pivot points can also be used to set your price objectives. Here is the price situation in relation to pivot points:
| Pivot points | S3 | S2 | S1 | PP | R1 | R2 | R3 |
|---|---|---|---|---|---|---|---|
| Standard | 37.99 | 38.43 | 39.33 | 39.77 | 40.67 | 41.11 | 42.01 |
| Camarilla | 39.85 | 39.97 | 40.10 | 40.22 | 40.34 | 40.47 | 40.59 |
| Woodie | 38.21 | 38.55 | 39.55 | 39.89 | 40.89 | 41.23 | 42.23 |
| Fibonacci | 38.43 | 38.95 | 39.26 | 39.77 | 40.29 | 40.60 | 41.11 |
| Pivot points | S3 | S2 | S1 | PP | R1 | R2 | R3 |
|---|---|---|---|---|---|---|---|
| Standard | 30.22 | 33.08 | 35.32 | 38.18 | 40.42 | 43.28 | 45.52 |
| Camarilla | 36.16 | 36.63 | 37.09 | 37.56 | 38.03 | 38.50 | 38.96 |
| Woodie | 29.91 | 32.93 | 35.01 | 38.03 | 40.11 | 43.13 | 45.21 |
| Fibonacci | 33.08 | 35.03 | 36.23 | 38.18 | 40.13 | 41.33 | 43.28 |
| Pivot points | S3 | S2 | S1 | PP | R1 | R2 | R3 |
|---|---|---|---|---|---|---|---|
| Standard | 29.19 | 32.57 | 36.39 | 39.77 | 43.59 | 46.97 | 50.79 |
| Camarilla | 38.24 | 38.90 | 39.56 | 40.22 | 40.88 | 41.54 | 42.20 |
| Woodie | 29.42 | 32.68 | 36.62 | 39.88 | 43.82 | 47.08 | 51.02 |
| Fibonacci | 32.57 | 35.32 | 37.02 | 39.77 | 42.52 | 44.22 | 46.97 |
Numerical data
The following are the details of the technical indicators and moving averages that were collected to generate this technical analysis:
| RSI (14): | 66.76 | |
| MACD (12,26,9): | 0.4500 | |
| Directional Movement: | 19.09 | |
| AROON (14): | 64.29 | |
| DEMA (21): | 40.11 | |
| Parabolic SAR (0,02-0,02-0,2): | 38.91 | |
| Elder Ray (13): | 0.45 | |
| Super Trend (3,10): | 39.13 | |
| Zig ZAG (10): | 40.16 | |
| VORTEX (21): | 1.2200 | |
| Stochastique (14,3,5): | 84.60 | |
| TEMA (21): | 40.38 | |
| Williams %R (14): | -19.74 | |
| Chande Momentum Oscillator (20): | 0.06 | |
| Repulse (5,40,3): | 0.5800 | |
| ROCnROLL: | 1 | |
| TRIX (15,9): | 0.1900 | |
| Courbe Coppock: | 1.51 |
| MA7: | 38.83 | |
| MA20: | 40.48 | |
| MA50: | 42.58 | |
| MA100: | 43.09 | |
| MAexp7: | 40.00 | |
| MAexp20: | 39.52 | |
| MAexp50: | 39.12 | |
| MAexp100: | 39.51 | |
| Price / MA7: | +3.53% | |
| Price / MA20: | -0.69% | |
| Price / MA50: | -5.59% | |
| Price / MA100: | -6.71% | |
| Price / MAexp7: | +0.50% | |
| Price / MAexp20: | +1.72% | |
| Price / MAexp50: | +2.76% | |
| Price / MAexp100: | +1.75% |
News
Don't forget to follow the news on FUCHS SEVZO NA O.N.. At the time of publication of this analysis, the latest news was as follows:
- EQS-News: FUCHS with good first half of 2024
- EQS-News: FUCHS successfully completes the acquisition of the LUBCON Group, a manufacturer of high-performance specialty lubricants
- EQS-News: FUCHS with good start into financial year 2024
- EQS-News: FUCHS acquires manufacturer for high-performance specialty lubricants
- EQS-News: FUCHS SE and Mercedes-Benz AG announce strategic business partnership to drive a quality collaboration in the Automotive After-Sales
About author
Online


Add a comment
Comments
0 comments on the analysis FUCHS SEVZO NA O.N. - 1H