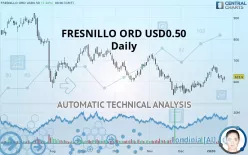
FRESNILLO ORD USD0.50 - Daily - Technical analysis published on 01/16/2020 (GMT)
- 348
- 0
- Who voted?
Click here for a new analysis!
- Timeframe : Daily
- - Analysis generated on
- Status : TARGET REACHED

Summary of the analysis

Additional analysis
Quotes
The FRESNILLO ORD USD0.50 rating is 623.6 GBX. The price registered an increase of +2.40% on the session and was between 607.4 GBX and 624.0 GBX. This implies that the price is at +2.67% from its lowest and at -0.06% from its highest.The Central Gaps scanner detects a bearish opening. A small advantage for sellers in the very short term.
Bearish opening
Type : Bearish
Timeframe : Openning
So that you have an overall view of the price change, here is a table showing the variations over several periods:
Technical
Technical analysis of FRESNILLO ORD USD0.50 in Daily shows an overall bearish trend. 64.29% of the signals given by moving averages are bearish. Caution: the slightly bullish signals currently being given by short-term moving averages indicate that this bearish trend may be slowing down. An assessment of moving averages reveals a bearish signal that could impact this trend:
Bearish price crossover with adaptative moving average 20
Type : Bearish
Timeframe : Daily
In fact, of the 18 technical indicators analysed by Central Analyzer, 4 are bullish, 8 are neutral and 6 are bearish. Central Indicators, the detector scanner for these technical indicators has recently detected several signals:
Pivot points : price is under support 1
Type : Neutral
Timeframe : Daily
Pivot points : price is under support 1
Type : Neutral
Timeframe : Weekly
Price is back over the pivot point
Type : Bullish
Timeframe : Weekly
Williams %R indicator is back under -50
Type : Bearish
Timeframe : Daily
An analysis of the price chart with the Central Patterns scanner (detector of chart patterns and resistances and supports) shows a result that can have an impact on the price change:
Near support of triangle
Type : Bullish
Timeframe : Daily
The Central Candlesticks scanner which studies Japanese candlesticks did not detect anything.
| S3 | S2 | S1 | Price | R1 | R2 | R3 | |
|---|---|---|---|---|---|---|---|
| ProTrendLines | 99.0 | 540.8 | 590.6 | 623.6 | 735.6 | 767.2 | 852.8 |
| Change (%) | -84.12% | -13.28% | -5.29% | - | +17.96% | +23.03% | +36.75% |
| Change | -524.6 | -82.8 | -33.0 | - | +112.0 | +143.6 | +229.2 |
| Level | Minor | Intermediate | Major | - | Intermediate | Minor | Minor |
Attention could also be paid to pivot points to set price objectives:
| Pivot points | S3 | S2 | S1 | PP | R1 | R2 | R3 |
|---|---|---|---|---|---|---|---|
| Standard | 594.0 | 603.8 | 611.4 | 621.2 | 628.8 | 638.6 | 646.2 |
| Camarilla | 614.2 | 615.8 | 617.4 | 619.0 | 620.6 | 622.2 | 623.8 |
| Woodie | 592.9 | 603.3 | 610.3 | 620.7 | 627.7 | 638.1 | 645.1 |
| Fibonacci | 603.8 | 610.5 | 614.6 | 621.2 | 627.9 | 632.0 | 638.6 |
| Pivot points | S3 | S2 | S1 | PP | R1 | R2 | R3 |
|---|---|---|---|---|---|---|---|
| Standard | 575.7 | 595.5 | 628.3 | 648.1 | 680.9 | 700.7 | 733.5 |
| Camarilla | 646.5 | 651.4 | 656.2 | 661.0 | 665.8 | 670.6 | 675.5 |
| Woodie | 582.1 | 598.8 | 634.7 | 651.4 | 687.3 | 704.0 | 739.9 |
| Fibonacci | 595.5 | 615.6 | 628.0 | 648.1 | 668.2 | 680.6 | 700.7 |
| Pivot points | S3 | S2 | S1 | PP | R1 | R2 | R3 |
|---|---|---|---|---|---|---|---|
| Standard | 468.5 | 504.7 | 574.1 | 610.3 | 679.7 | 715.9 | 785.3 |
| Camarilla | 614.4 | 624.0 | 633.7 | 643.4 | 653.1 | 662.8 | 672.4 |
| Woodie | 485.0 | 513.0 | 590.6 | 618.6 | 696.2 | 724.2 | 801.8 |
| Fibonacci | 504.7 | 545.1 | 570.0 | 610.3 | 650.7 | 675.6 | 715.9 |
Numerical data
The following are the details of the technical indicators and moving averages that were collected to generate this technical analysis:
| RSI (14): | 47.10 | |
| MACD (12,26,9): | 7.5000 | |
| Directional Movement: | -3.0 | |
| AROON (14): | 57.1 | |
| DEMA (21): | 628.4 | |
| Parabolic SAR (0,02-0,02-0,2): | 672.3 | |
| Elder Ray (13): | -17.4 | |
| Super Trend (3,10): | 604.1 | |
| Zig ZAG (10): | 609.0 | |
| VORTEX (21): | 1.1000 | |
| Stochastique (14,3,5): | 42.00 | |
| TEMA (21): | 639.7 | |
| Williams %R (14): | -67.10 | |
| Chande Momentum Oscillator (20): | 8.4 | |
| Repulse (5,40,3): | -3.3000 | |
| ROCnROLL: | 2 | |
| TRIX (15,9): | 0.2000 | |
| Courbe Coppock: | 15.00 |
| MA7: | 633.2 | |
| MA20: | 616.1 | |
| MA50: | 614.1 | |
| MA100: | 653.4 | |
| MAexp7: | 625.2 | |
| MAexp20: | 619.3 | |
| MAexp50: | 622.1 | |
| MAexp100: | 651.8 | |
| Price / MA7: | -1.52% | |
| Price / MA20: | +1.22% | |
| Price / MA50: | +1.55% | |
| Price / MA100: | -4.56% | |
| Price / MAexp7: | -0.26% | |
| Price / MAexp20: | +0.69% | |
| Price / MAexp50: | +0.24% | |
| Price / MAexp100: | -4.33% |
About author

Online


Add a comment
Comments
0 comments on the analysis FRESNILLO ORD USD0.50 - Daily