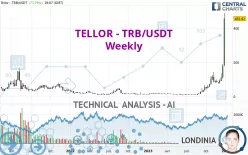
TELLOR - TRB/USDT - Weekly - Technical analysis published on 12/31/2023 (GMT)
- 434
- 0
- Timeframe : Weekly
- - Analysis generated on
- Status : WITHOUT TARGET

Summary of the analysis

Additional analysis
Quotes
The TELLOR - TRB/USDT price is 455.92 USDT. The price registered an increase of +149.76% over 5 days with the lowest point at 177.35 USDT and the highest point at 488.47 USDT. The deviation from the price is +157.07% for the low point and -6.66% for the high point.The Central Gaps scanner detects a bearish opening marking the presence of sellers ahead of buyers at the opening but not sufficiently marked to allow the price to register a quotation gap.
Bullish opening
Type : Bullish
Timeframe : Openning
Bearish opening
Type : Bearish
Timeframe : Openning
Here is a more detailed summary of the historical variations registered by TELLOR - TRB/USDT:
New HIGH record (5 years)
Type : Bullish
Timeframe : Weekly
New HIGH record (1 year)
Type : Bullish
Timeframe : Weekly
New HIGH record (1st january)
Type : Bullish
Timeframe : Weekly
New HIGH record (1 month)
Type : Bullish
Timeframe : Weekly
Technical
A technical analysis in Weekly of this TELLOR - TRB/USDT chart shows a strongly bullish trend. 92.86% of the signals given by moving averages are bullish. The overall trend is supported by the strong bullish signals from short-term moving averages. There is no crossing of moving average by the price or crossing of moving averages between themselves.
Technical indicators are strongly bullish, suggesting that the price increase should continue.
Caution: the Central Indicators scanner currently detects an excess:
RSI indicator is overbought : over 90
Type : Neutral
Timeframe : Weekly
CCI indicator is overbought : over 100
Type : Neutral
Timeframe : Weekly
Williams %R indicator is overbought : over -20
Type : Neutral
Timeframe : Weekly
Pivot points : price is over resistance 3
Type : Neutral
Timeframe : Weekly
Central Patterns, the market scanner focusing on chart patterns, resistances and supports found this result:
Resistance of channel is broken
Type : Bullish
Timeframe : Weekly
For a small rebound in the very short term, the Central Candlesticks scanner currently notes the presence of this bullish pattern in Japanese candlesticks:
Long white line
Type : Bullish
Timeframe : Weekly
| S3 | S2 | S1 | Price | |
|---|---|---|---|---|
| ProTrendLines | 45.20 | 72.96 | 145.61 | 455.92 |
| Change (%) | -90.09% | -84.00% | -68.06% | - |
| Change | -410.72 | -382.96 | -310.31 | - |
| Level | Intermediate | Major | Intermediate | - |
Pivot points can also be used to set your price objectives. Here is the price situation in relation to pivot points:
| Pivot points | S3 | S2 | S1 | PP | R1 | R2 | R3 |
|---|---|---|---|---|---|---|---|
| Standard | 211.98 | 223.10 | 242.72 | 253.84 | 273.46 | 284.58 | 304.20 |
| Camarilla | 253.89 | 256.70 | 259.52 | 262.34 | 265.16 | 267.98 | 270.79 |
| Woodie | 216.23 | 225.23 | 246.97 | 255.97 | 277.71 | 286.71 | 308.45 |
| Fibonacci | 223.10 | 234.84 | 242.10 | 253.84 | 265.58 | 272.84 | 284.58 |
| Pivot points | S3 | S2 | S1 | PP | R1 | R2 | R3 |
|---|---|---|---|---|---|---|---|
| Standard | 109.75 | 141.31 | 201.83 | 233.39 | 293.91 | 325.47 | 385.99 |
| Camarilla | 237.02 | 245.46 | 253.90 | 262.34 | 270.78 | 279.22 | 287.66 |
| Woodie | 124.22 | 148.55 | 216.30 | 240.63 | 308.38 | 332.71 | 400.46 |
| Fibonacci | 141.31 | 176.49 | 198.22 | 233.39 | 268.57 | 290.30 | 325.47 |
| Pivot points | S3 | S2 | S1 | PP | R1 | R2 | R3 |
|---|---|---|---|---|---|---|---|
| Standard | 42.72 | 58.40 | 68.40 | 84.08 | 94.08 | 109.76 | 119.76 |
| Camarilla | 71.33 | 73.68 | 76.04 | 78.39 | 80.74 | 83.10 | 85.45 |
| Woodie | 39.87 | 56.98 | 65.55 | 82.66 | 91.23 | 108.34 | 116.91 |
| Fibonacci | 58.40 | 68.21 | 74.27 | 84.08 | 93.89 | 99.95 | 109.76 |
Numerical data
The following is the status of technical indicators and moving averages registered at the time this technical analysis was created:
| RSI (14): | 93.82 | |
| MACD (12,26,9): | 62.2400 | |
| Directional Movement: | 70.29 | |
| AROON (14): | 100.00 | |
| DEMA (21): | 195.94 | |
| Parabolic SAR (0,02-0,02-0,2): | 83.08 | |
| Elder Ray (13): | 202.94 | |
| Super Trend (3,10): | 197.61 | |
| Zig ZAG (10): | 437.79 | |
| VORTEX (21): | 1.2800 | |
| Stochastique (14,3,5): | 94.53 | |
| TEMA (21): | 243.50 | |
| Williams %R (14): | -11.03 | |
| Chande Momentum Oscillator (20): | 381.13 | |
| Repulse (5,40,3): | 104.9500 | |
| ROCnROLL: | 1 | |
| TRIX (15,9): | 12.0000 | |
| Courbe Coppock: | 905.69 |
| MA7: | 248.03 | |
| MA20: | 173.61 | |
| MA50: | 120.54 | |
| MA100: | 97.72 | |
| MAexp7: | 227.22 | |
| MAexp20: | 126.13 | |
| MAexp50: | 71.11 | |
| MAexp100: | 47.90 | |
| Price / MA7: | +83.82% | |
| Price / MA20: | +162.61% | |
| Price / MA50: | +278.23% | |
| Price / MA100: | +366.56% | |
| Price / MAexp7: | +100.65% | |
| Price / MAexp20: | +261.47% | |
| Price / MAexp50: | +541.15% | |
| Price / MAexp100: | +851.82% |
About author

Online


Add a comment
Comments
0 comments on the analysis TELLOR - TRB/USDT - Weekly