TELLOR - TRB/USDT - Daily - Technical analysis published on 12/22/2023 (GMT)
- 513
- 0
Click here for a new analysis!
- Timeframe : Daily
- - Analysis generated on
- Status : TARGET REACHED

Summary of the analysis

Additional analysis
Quotes
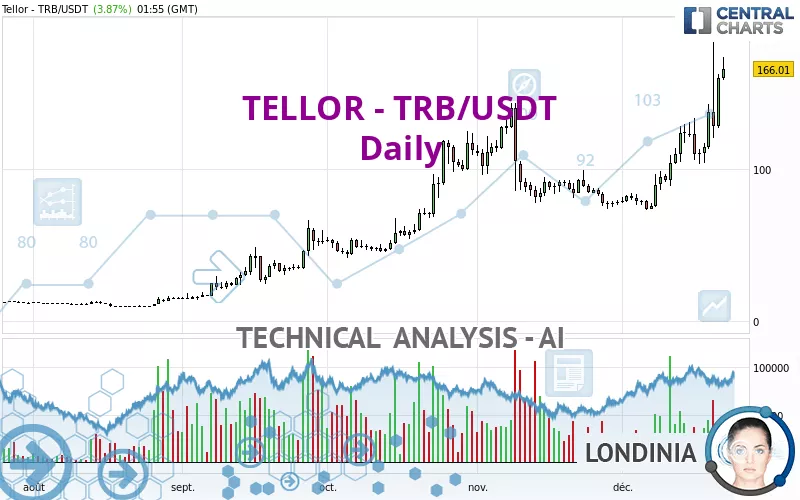
The TELLOR - TRB/USDT price is 166.01 USDT. On the day, this instrument gained +3.87% and was traded between 158.49 USDT and 174.06 USDT over the period. The price is currently at +4.74% from its lowest and -4.62% from its highest.The Central Gaps scanner detects a bearish opening. A small advantage for sellers in the very short term.
Bearish opening
Type : Bearish
Timeframe : Openning
Here is a more detailed summary of the historical variations registered by TELLOR - TRB/USDT:
New HIGH record (5 years)
Type : Bullish
Timeframe : Weekly
New HIGH record (1st january)
Type : Bullish
Timeframe : Weekly
Technical
Technical analysis of TELLOR - TRB/USDT in Daily shows a strongly overall bullish trend. 92.86% of the signals given by moving averages are bullish. The overall trend is supported by the strong bullish signals from short-term moving averages. There is no crossing of moving average by the price or crossing of moving averages between themselves.
In fact, according to the parameters integrated into the Central Analyzer system, 16 technical indicators out of 18 analysed are currently bullish. Caution: the Central Indicators scanner currently detects an excess:
RSI indicator is overbought : over 70
Type : Neutral
Timeframe : Daily
CCI indicator is overbought : over 100
Type : Neutral
Timeframe : Daily
Pivot points : price is over resistance 2
Type : Neutral
Timeframe : Weekly
The analysis of the price chart with Central Patterns scanners does not return any result.
The Central Candlesticks scanner, specialised in Japanese candlesticks, did not identify any signals.
| S3 | S2 | S1 | Price | |
|---|---|---|---|---|
| ProTrendLines | 92.68 | 118.33 | 145.61 | 166.01 |
| Change (%) | -44.17% | -28.72% | -12.29% | - |
| Change | -73.33 | -47.68 | -20.40 | - |
| Level | Major | Major | Major | - |
Attention could also be paid to pivot points to set price objectives:
| Pivot points | S3 | S2 | S1 | PP | R1 | R2 | R3 |
|---|---|---|---|---|---|---|---|
| Standard | 100.98 | 113.93 | 136.88 | 149.83 | 172.78 | 185.73 | 208.68 |
| Camarilla | 149.96 | 153.25 | 156.54 | 159.83 | 163.12 | 166.41 | 169.70 |
| Woodie | 105.98 | 116.43 | 141.88 | 152.33 | 177.78 | 188.23 | 213.68 |
| Fibonacci | 113.93 | 127.64 | 136.12 | 149.83 | 163.54 | 172.02 | 185.73 |
| Pivot points | S3 | S2 | S1 | PP | R1 | R2 | R3 |
|---|---|---|---|---|---|---|---|
| Standard | 43.37 | 66.25 | 88.03 | 110.91 | 132.69 | 155.57 | 177.35 |
| Camarilla | 97.54 | 101.63 | 105.73 | 109.82 | 113.91 | 118.01 | 122.10 |
| Woodie | 42.83 | 65.98 | 87.49 | 110.64 | 132.15 | 155.30 | 176.81 |
| Fibonacci | 66.25 | 83.31 | 93.85 | 110.91 | 127.97 | 138.51 | 155.57 |
| Pivot points | S3 | S2 | S1 | PP | R1 | R2 | R3 |
|---|---|---|---|---|---|---|---|
| Standard | -15.99 | 29.05 | 53.72 | 98.76 | 123.43 | 168.47 | 193.14 |
| Camarilla | 59.22 | 65.61 | 72.00 | 78.39 | 84.78 | 91.17 | 97.56 |
| Woodie | -26.18 | 23.96 | 43.54 | 93.67 | 113.25 | 163.38 | 182.96 |
| Fibonacci | 29.05 | 55.68 | 72.13 | 98.76 | 125.39 | 141.84 | 168.47 |
Numerical data
The following is the status of the technical indicators and moving averages at the time of publication of this technical analysis:
| RSI (14): | 75.72 | |
| MACD (12,26,9): | 15.9100 | |
| Directional Movement: | 32.22 | |
| AROON (14): | 85.71 | |
| DEMA (21): | 135.24 | |
| Parabolic SAR (0,02-0,02-0,2): | 120.53 | |
| Elder Ray (13): | 39.71 | |
| Super Trend (3,10): | 105.36 | |
| Zig ZAG (10): | 165.79 | |
| VORTEX (21): | 1.2400 | |
| Stochastique (14,3,5): | 69.87 | |
| TEMA (21): | 147.27 | |
| Williams %R (14): | -18.50 | |
| Chande Momentum Oscillator (20): | 73.05 | |
| Repulse (5,40,3): | 12.3000 | |
| ROCnROLL: | 1 | |
| TRIX (15,9): | 1.4700 | |
| Courbe Coppock: | 124.57 |
| MA7: | 132.50 | |
| MA20: | 108.96 | |
| MA50: | 99.73 | |
| MA100: | 80.26 | |
| MAexp7: | 139.53 | |
| MAexp20: | 117.45 | |
| MAexp50: | 100.18 | |
| MAexp100: | 82.11 | |
| Price / MA7: | +25.29% | |
| Price / MA20: | +52.36% | |
| Price / MA50: | +66.46% | |
| Price / MA100: | +106.84% | |
| Price / MAexp7: | +18.98% | |
| Price / MAexp20: | +41.35% | |
| Price / MAexp50: | +65.71% | |
| Price / MAexp100: | +102.18% |
About author

Online


Add a comment
Comments
0 comments on the analysis TELLOR - TRB/USDT - Daily