KUSAMA - KSM/USD - 1H - Technical analysis published on 11/23/2024 (GMT)
- 126
- 0
Click here for a new analysis!
- Timeframe : 1H
- - Analysis generated on
- Status : TARGET REACHED
Summary of the analysis

Additional analysis
Quotes
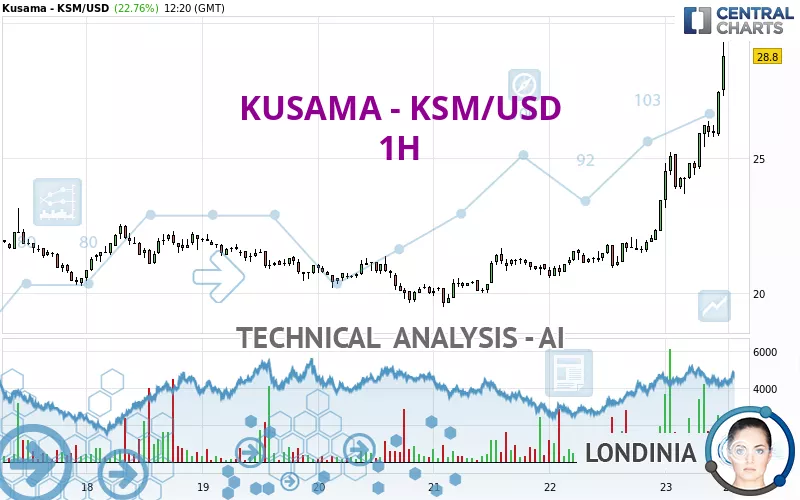
The KUSAMA - KSM/USD price is 28.80 USD. The price has increased by +22.76% since the last closing with the lowest point at 23.15 USD and the highest point at 29.30 USD. The deviation from the price is +24.41% for the low point and -1.71% for the high point.A bearish opening was detected by the Central Gaps scanner. Sellers are trying to impose a bearish trend in the very short term.
Bearish opening
Type : Bearish
Timeframe : Openning
Here is a more detailed summary of the historical variations registered by KUSAMA - KSM/USD:
New HIGH record (1st january)
Type : Bullish
Timeframe : Weekly
New HIGH record (1 month)
Type : Bullish
Timeframe : Weekly
Technical
Technical analysis of this 1H chart of KUSAMA - KSM/USD indicates that the overall trend is strongly bullish. The signals given by the moving averages are 92.86% bullish. This strong bullish trend is confirmed by the strong signals currently being given by short-term moving averages. The Central Indicators scanner does not detect any result on moving averages that would impact this trend.
Technical indicators are strongly bullish, suggesting that the price increase should continue.
But beware of excesses. The Central Indicators scanner currently detects this:
RSI indicator is overbought : over 80
Type : Neutral
Timeframe : 1 hour
CCI indicator is overbought : over 100
Type : Neutral
Timeframe : 1 hour
Williams %R indicator is overbought : over -20
Type : Neutral
Timeframe : 1 hour
Pivot points : price is over resistance 2
Type : Neutral
Timeframe : Weekly
Pivot points : price is over resistance 3
Type : Neutral
Timeframe : 1 hour
An analysis of the price chart with the Central Patterns scanner (detector of chart patterns and resistances and supports) shows a result that can have an impact on the price change:
Resistance of channel is broken
Type : Bullish
Timeframe : 1 hour
The presence of a bearish pattern in Japanese candlesticks detected by Central Candlesticks that could cause a correction in the very short term was also detected:
Bearish doji star
Type : Bearish
Timeframe : 1 hour
| S3 | S2 | S1 | Price | R1 | R2 | R3 | |
|---|---|---|---|---|---|---|---|
| ProTrendLines | 22.33 | 23.13 | 27.09 | 28.80 | 30.13 | 32.61 | 59.52 |
| Change (%) | -22.47% | -19.69% | -5.94% | - | +4.62% | +13.23% | +106.67% |
| Change | -6.47 | -5.67 | -1.71 | - | +1.33 | +3.81 | +30.72 |
| Level | Intermediate | Intermediate | Minor | - | Minor | Major | Major |
To determine price objectives, it is also possible to use the pivot points. Here is the price position in relation to pivot points:
| Pivot points | S3 | S2 | S1 | PP | R1 | R2 | R3 |
|---|---|---|---|---|---|---|---|
| Standard | 18.61 | 19.59 | 21.52 | 22.50 | 24.43 | 25.41 | 27.34 |
| Camarilla | 22.66 | 22.93 | 23.19 | 23.46 | 23.73 | 23.99 | 24.26 |
| Woodie | 19.10 | 19.83 | 22.01 | 22.74 | 24.92 | 25.65 | 27.83 |
| Fibonacci | 19.59 | 20.70 | 21.39 | 22.50 | 23.61 | 24.30 | 25.41 |
| Pivot points | S3 | S2 | S1 | PP | R1 | R2 | R3 |
|---|---|---|---|---|---|---|---|
| Standard | 14.68 | 16.21 | 19.14 | 20.67 | 23.60 | 25.13 | 28.06 |
| Camarilla | 20.85 | 21.26 | 21.67 | 22.08 | 22.49 | 22.90 | 23.31 |
| Woodie | 15.39 | 16.56 | 19.85 | 21.02 | 24.31 | 25.48 | 28.77 |
| Fibonacci | 16.21 | 17.91 | 18.96 | 20.67 | 22.37 | 23.42 | 25.13 |
| Pivot points | S3 | S2 | S1 | PP | R1 | R2 | R3 |
|---|---|---|---|---|---|---|---|
| Standard | 11.16 | 13.58 | 15.07 | 17.49 | 18.98 | 21.40 | 22.89 |
| Camarilla | 15.50 | 15.85 | 16.21 | 16.57 | 16.93 | 17.29 | 17.65 |
| Woodie | 10.71 | 13.35 | 14.62 | 17.26 | 18.53 | 21.17 | 22.44 |
| Fibonacci | 13.58 | 15.07 | 15.99 | 17.49 | 18.98 | 19.90 | 21.40 |
Numerical data
The following are the details of the technical indicators and moving averages that were collected to generate this technical analysis:
| RSI (14): | 79.58 | |
| MACD (12,26,9): | 1.3600 | |
| Directional Movement: | 41.12 | |
| AROON (14): | 100.00 | |
| DEMA (21): | 26.44 | |
| Parabolic SAR (0,02-0,02-0,2): | 24.39 | |
| Elder Ray (13): | 2.07 | |
| Super Trend (3,10): | 25.47 | |
| Zig ZAG (10): | 27.75 | |
| VORTEX (21): | 1.4100 | |
| Stochastique (14,3,5): | 95.04 | |
| TEMA (21): | 27.11 | |
| Williams %R (14): | -10.17 | |
| Chande Momentum Oscillator (20): | 2.87 | |
| Repulse (5,40,3): | 5.2300 | |
| ROCnROLL: | 1 | |
| TRIX (15,9): | 0.7000 | |
| Courbe Coppock: | 30.76 |
| MA7: | 22.22 | |
| MA20: | 19.77 | |
| MA50: | 18.62 | |
| MA100: | 19.12 | |
| MAexp7: | 26.36 | |
| MAexp20: | 24.46 | |
| MAexp50: | 22.91 | |
| MAexp100: | 22.12 | |
| Price / MA7: | +29.61% | |
| Price / MA20: | +45.68% | |
| Price / MA50: | +54.67% | |
| Price / MA100: | +50.63% | |
| Price / MAexp7: | +9.26% | |
| Price / MAexp20: | +17.74% | |
| Price / MAexp50: | +25.71% | |
| Price / MAexp100: | +30.20% |
About author
Online


Add a comment
Comments
0 comments on the analysis KUSAMA - KSM/USD - 1H