NEAR PROTOCOL - NEAR/USDT overview
NEAR PROTOCOL - NEAR/USDT
> Analyses
 Thank you
Reply
Chart
Thank you
Reply
Chart
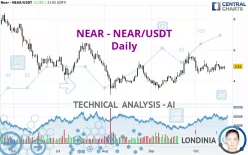
Timeframe : Daily - Simple chart
Status : INVALID
A bullish trend on NEAR - NEAR/USDT both in substance and in the short term. A purchase could be considered as long as the price remains above 4.40 USDT. Each resistance break is a strong signal that…
NEAR PROTOCOL - NEAR/USDT
> Analyses
 Thank you
Reply
Chart
Thank you
Reply
Chart
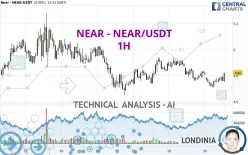
Timeframe : 1H - Simple chart
Status : INVALID
We are currently in a phase of short-term indecision. In a case like this, you could favour trades in the direction of the basic trend on NEAR - NEAR/USDT. As long as you are under the resistance…
NEAR PROTOCOL - NEAR/USDT
> Analyses
 Thank you
Reply
Chart
Thank you
Reply
Chart
Timeframe : 1H - Simple chart
Status : LEVEL MAINTAINED
Has the basic bullish trend slowed or is it lacking in power? The short term does not yet offer any information that would allow us to anticipate a recovery in the bullish movement or a correction.…
NEAR PROTOCOL - NEAR/USDT
> Analyses
 Thank you
Reply
Chart
Thank you
Reply
Chart
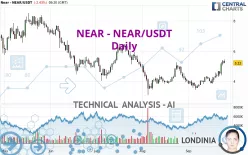
Timeframe : Daily - Simple chart
Status : INVALID
All elements being clearly bullish, it would be possible for traders to trade only long positions (at the time of purchase) on NEAR - NEAR/USDT as long as the price remains well above 5.03 USDT. The…
NEAR PROTOCOL - NEAR/USDT
> Analyses

 Thank you
Reply
Chart
Thank you
Reply
Chart
tariyia has published a new analysis.
- 5
- 118
- 86
- 5
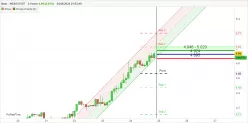
Timeframe : 2H - Chart + Trading signal
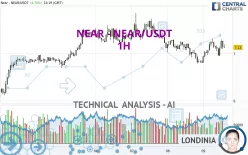
NEAR/USDT @ (Timeframe 2 hour)
Williams Fractal Trailing Stops Bullish (TF 2H)
MA (200) | EMA (200) Bullish (TF 1H)
EMA (10) Bullish (TF 1H)
At Higher Timeframe
Momentum (10) Bullish (TF…
NEAR PROTOCOL - NEAR/USDT
> Analyses
 Thank you
Reply
Chart
Thank you
Reply
Chart
tariyia has published a new analysis.
- 5
- 118
- 86
- 5
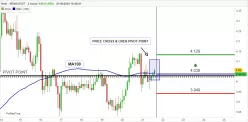
Timeframe : 2H - Chart + Trading signal
NEAR/USDT @ (Timeframe 2 hour)
Bullish price crossover with Moving Average 100 (TF 2H)
Price is back over the pivot point (TF 2H)
EMA (10) Bullish (TF 1H)
At Higher Timeframe
Momentum (10)…
NEAR PROTOCOL - NEAR/USDT
> Analyses
 Thank you
Reply
Chart
Thank you
Reply
Chart
tariyia has published a new analysis.
- 5
- 118
- 86
- 5
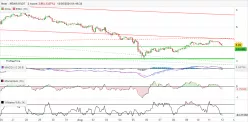
Timeframe : 2H - Chart + Trading signal
NEAR/USDT at TF 2H
Bearish Trend Reversal AMA50 2H
Williams Trailing Stops Bearish 2H
Level MACD (12,26) Bearish 1H
EMA (10) Bearish 1H
HIGHER TF
Bearish Momentum (10) 1D
Hull Moving Average…
NEAR PROTOCOL - NEAR/USDT
> Analyses
 Thank you
Reply
Chart
Thank you
Reply
Chart
Timeframe : 1H - Simple chart
Status : NEUTRAL
A slightly bearish trend and a neutral short term. With such a pattern, it is difficult to favour buying or selling. The first support is located at 6.79 USDT. The first resistance is located at 7.54…

