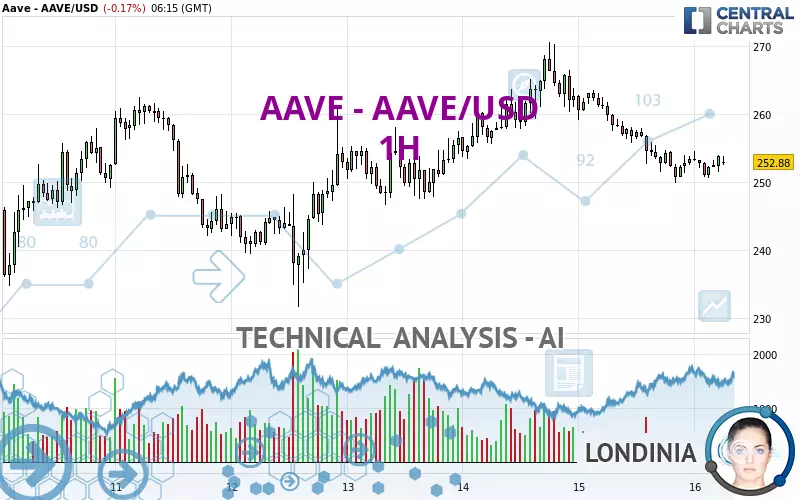
AAVE - AAVE/USD - 1H - Technical analysis published on 02/16/2025 (GMT)
- 121
- 0
Click here for a new analysis!
- Timeframe : 1H
- - Analysis generated on
- Status : LEVEL MAINTAINED

Summary of the analysis

Additional analysis
Quotes
The AAVE - AAVE/USD rating is 252.87 USD. The price is lower by -0.18% since the last closing and was traded between 250.61 USD and 254.48 USD over the period. The price is currently at +0.90% from its lowest and -0.63% from its highest.A bullish opening was detected by the Central Gaps scanner. Buyers are trying to impose a bullish momentum in the very short term.
Bullish opening
Type : Bullish
Timeframe : Openning
A study of price movements over other periods shows the following variations:
Technical
Technical analysis of this 1H chart of AAVE - AAVE/USD indicates that the overall trend is bearish. 75.00% of the signals given by moving averages are bearish. The overall trend is reinforced by the strong bearish signals from short-term moving averages. The Central Indicators market scanner is currently detecting several bearish signals that could impact this trend:
Bearish price crossover with Moving Average 20
Type : Bearish
Timeframe : 1 hour
Bearish price crossover with Moving Average 100
Type : Bearish
Timeframe : 1 hour
Bearish price crossover with adaptative moving average 20
Type : Bearish
Timeframe : 1 hour
The technical indicators are generally neutral. They do not provide relevant information on the direction of future price movements.
Central Indicators, the detector scanner for these technical indicators has recently detected several signals:
Pivot points : price is over resistance 2
Type : Neutral
Timeframe : 1 hour
Price is back over the pivot point
Type : Bullish
Timeframe : Weekly
Momentum indicator is back under 0
Type : Bearish
Timeframe : 1 hour
Central Patterns, the market scanner focusing on chart patterns, resistances and supports found this result:
Horizontal resistance is broken
Type : Bullish
Timeframe : 1 hour
The presence of these Japanese chandelier patterns detected by Central Candlesticks that could impact the current short-term trend were also noted:
Bearish harami
Type : Bearish
Timeframe : 1 hour
Doji
Type : Neutral
Timeframe : 1 hour
| S3 | S2 | S1 | Price | R1 | R2 | R3 | |
|---|---|---|---|---|---|---|---|
| ProTrendLines | 231.36 | 238.05 | 246.80 | 252.87 | 257.90 | 262.55 | 270.56 |
| Change (%) | -8.51% | -5.86% | -2.40% | - | +1.99% | +3.83% | +7.00% |
| Change | -21.51 | -14.82 | -6.07 | - | +5.03 | +9.68 | +17.69 |
| Level | Major | Intermediate | Minor | - | Intermediate | Minor | Intermediate |
Pivot points can also be used to set your price objectives. Here is the price situation in relation to pivot points:
| Pivot points | S3 | S2 | S1 | PP | R1 | R2 | R3 |
|---|---|---|---|---|---|---|---|
| Standard | 233.96 | 241.91 | 247.62 | 255.57 | 261.28 | 269.23 | 274.94 |
| Camarilla | 249.56 | 250.82 | 252.07 | 253.32 | 254.57 | 255.82 | 257.08 |
| Woodie | 232.83 | 241.35 | 246.49 | 255.01 | 260.15 | 268.67 | 273.81 |
| Fibonacci | 241.91 | 247.13 | 250.36 | 255.57 | 260.79 | 264.02 | 269.23 |
| Pivot points | S3 | S2 | S1 | PP | R1 | R2 | R3 |
|---|---|---|---|---|---|---|---|
| Standard | 191.57 | 210.81 | 232.07 | 251.31 | 272.57 | 291.81 | 313.07 |
| Camarilla | 242.18 | 245.90 | 249.61 | 253.32 | 257.03 | 260.75 | 264.46 |
| Woodie | 192.57 | 211.32 | 233.07 | 251.82 | 273.57 | 292.32 | 314.07 |
| Fibonacci | 210.81 | 226.28 | 235.84 | 251.31 | 266.78 | 276.34 | 291.81 |
| Pivot points | S3 | S2 | S1 | PP | R1 | R2 | R3 |
|---|---|---|---|---|---|---|---|
| Standard | 144.33 | 200.27 | 266.35 | 322.29 | 388.37 | 444.31 | 510.39 |
| Camarilla | 298.88 | 310.06 | 321.25 | 332.43 | 343.62 | 354.80 | 365.99 |
| Woodie | 149.40 | 202.81 | 271.42 | 324.83 | 393.44 | 446.85 | 515.46 |
| Fibonacci | 200.27 | 246.88 | 275.68 | 322.29 | 368.90 | 397.70 | 444.31 |
Numerical data
The following are the details of the technical indicators and moving averages that were collected to generate this technical analysis:
| RSI (14): | 42.75 | |
| MACD (12,26,9): | -1.4800 | |
| Directional Movement: | -9.53 | |
| AROON (14): | -28.57 | |
| DEMA (21): | 251.86 | |
| Parabolic SAR (0,02-0,02-0,2): | 250.76 | |
| Elder Ray (13): | 0.04 | |
| Super Trend (3,10): | 257.74 | |
| Zig ZAG (10): | 252.72 | |
| VORTEX (21): | 0.9000 | |
| Stochastique (14,3,5): | 57.07 | |
| TEMA (21): | 251.17 | |
| Williams %R (14): | -41.08 | |
| Chande Momentum Oscillator (20): | -1.53 | |
| Repulse (5,40,3): | 0.3600 | |
| ROCnROLL: | 2 | |
| TRIX (15,9): | -0.1100 | |
| Courbe Coppock: | 1.77 |
| MA7: | 253.48 | |
| MA20: | 266.07 | |
| MA50: | 298.27 | |
| MA100: | 277.04 | |
| MAexp7: | 252.76 | |
| MAexp20: | 253.97 | |
| MAexp50: | 255.51 | |
| MAexp100: | 254.53 | |
| Price / MA7: | -0.24% | |
| Price / MA20: | -4.96% | |
| Price / MA50: | -15.22% | |
| Price / MA100: | -8.72% | |
| Price / MAexp7: | +0.04% | |
| Price / MAexp20: | -0.43% | |
| Price / MAexp50: | -1.03% | |
| Price / MAexp100: | -0.65% |
About author
Online


Add a comment
Comments
0 comments on the analysis AAVE - AAVE/USD - 1H