| Open: | - |
| Change: | - |
| Volume: | - |
| Low: | - |
| High: | - |
| High / Low range: | - |
| Type: | Stocks |
| Ticker: | FCX |
| ISIN: |
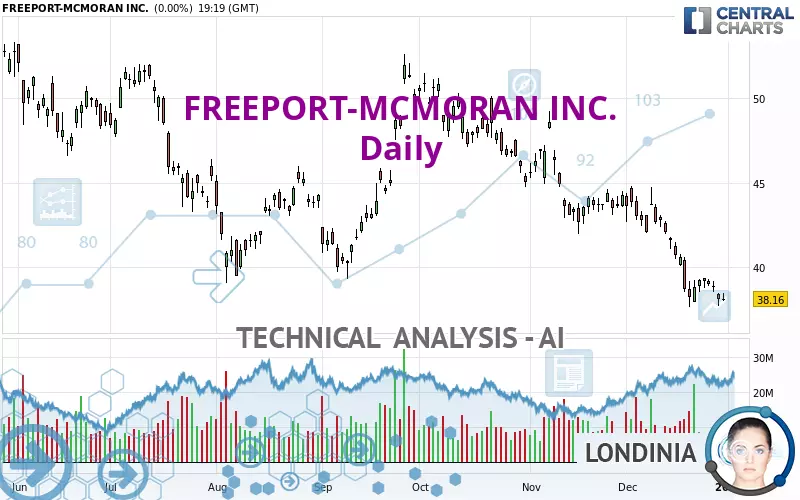
FREEPORT-MCMORAN INC. - Daily - Technical analysis published on 12/31/2024 (GMT)
- 118
- 0
- 12/31/2024 - 19:35
Click here for a new analysis!
- Timeframe : Daily
- - Analysis generated on 12/31/2024 - 19:35
- Status : INVALID

Summary of the analysis

Additional analysis
Quotes
The FREEPORT-MCMORAN INC. rating is 38.15 USD. The price registered a decrease of -0.03% on the session with the lowest point at 38.01 USD and the highest point at 38.47 USD. The deviation from the price is +0.37% for the low point and -0.83% for the high point.Here is a more detailed summary of the historical variations registered by FREEPORT-MCMORAN INC.:
Near a new LOW record (1 month)
Type : Bearish
Timeframe : Weekly
Technical
A technical analysis in Daily of this FREEPORT-MCMORAN INC. chart shows a sharp bearish trend. The signals given by moving averages are 92.86% bearish. This strong bearish trend is confirmed by the strong signals currently being given by short-term moving averages. The Central Indicators market scanner currently does not detect any result that concerns moving averages.
In fact, 12 technical indicators on 18 studied are currently positioned bearish. But beware of excesses. The Central Indicators scanner currently detects this:
RSI indicator is oversold : under 30
Type : Neutral
Timeframe : Daily
CCI indicator: bullish divergence
Type : Bullish
Timeframe : Daily
Williams %R indicator is oversold : under -80
Type : Neutral
Timeframe : Daily
Pivot points : price is under support 3
Type : Neutral
Timeframe : Weekly
Price is back over the pivot point
Type : Bullish
Timeframe : Daily
Central Patterns, the market scanner focusing on chart patterns, resistances and supports found this result:
Near support of channel
Type : Bullish
Timeframe : Daily
Central Candlesticks, the scanner specialised in Japanese candlesticks, detects this inversion signal that could impact the current short-term trend:
Doji
Type : Neutral
Timeframe : Daily
| S3 | S2 | S1 | Price | R1 | R2 | R3 | |
|---|---|---|---|---|---|---|---|
| ProTrendLines | 24.53 | 29.54 | 35.07 | 38.15 | 39.49 | 44.40 | 46.25 |
| Change (%) | -35.70% | -22.57% | -8.07% | - | +3.51% | +16.38% | +21.23% |
| Change | -13.62 | -8.61 | -3.08 | - | +1.34 | +6.25 | +8.10 |
| Level | Major | Minor | Major | - | Major | Major | Intermediate |
To determine price objectives, it is also possible to use the pivot points. Here is the price position in relation to pivot points:
| Pivot points | S3 | S2 | S1 | PP | R1 | R2 | R3 |
|---|---|---|---|---|---|---|---|
| Standard | 37.03 | 37.39 | 37.77 | 38.13 | 38.51 | 38.87 | 39.25 |
| Camarilla | 37.96 | 38.02 | 38.09 | 38.16 | 38.23 | 38.30 | 38.36 |
| Woodie | 37.05 | 37.40 | 37.79 | 38.14 | 38.53 | 38.88 | 39.27 |
| Fibonacci | 37.39 | 37.67 | 37.84 | 38.13 | 38.41 | 38.58 | 38.87 |
| Pivot points | S3 | S2 | S1 | PP | R1 | R2 | R3 |
|---|---|---|---|---|---|---|---|
| Standard | 37.65 | 38.11 | 38.48 | 38.94 | 39.31 | 39.77 | 40.14 |
| Camarilla | 38.63 | 38.71 | 38.78 | 38.86 | 38.94 | 39.01 | 39.09 |
| Woodie | 37.62 | 38.09 | 38.45 | 38.92 | 39.28 | 39.75 | 40.11 |
| Fibonacci | 38.11 | 38.42 | 38.62 | 38.94 | 39.25 | 39.45 | 39.77 |
| Pivot points | S3 | S2 | S1 | PP | R1 | R2 | R3 |
|---|---|---|---|---|---|---|---|
| Standard | 33.89 | 37.94 | 41.10 | 45.15 | 48.31 | 52.36 | 55.52 |
| Camarilla | 42.27 | 42.93 | 43.59 | 44.25 | 44.91 | 45.57 | 46.23 |
| Woodie | 33.44 | 37.72 | 40.65 | 44.93 | 47.86 | 52.14 | 55.07 |
| Fibonacci | 37.94 | 40.70 | 42.40 | 45.15 | 47.91 | 49.61 | 52.36 |
Numerical data
The following is the status of technical indicators and moving averages registered at the time this technical analysis was created:
| RSI (14): | 28.93 | |
| MACD (12,26,9): | -1.5500 | |
| Directional Movement: | -28.00 | |
| AROON (14): | -50.00 | |
| DEMA (21): | 38.39 | |
| Parabolic SAR (0,02-0,02-0,2): | 39.54 | |
| Elder Ray (13): | -1.34 | |
| Super Trend (3,10): | 41.20 | |
| Zig ZAG (10): | 38.05 | |
| VORTEX (21): | 0.6800 | |
| Stochastique (14,3,5): | 10.76 | |
| TEMA (21): | 37.87 | |
| Williams %R (14): | -92.57 | |
| Chande Momentum Oscillator (20): | -4.01 | |
| Repulse (5,40,3): | -0.7000 | |
| ROCnROLL: | 2 | |
| TRIX (15,9): | -0.4800 | |
| Courbe Coppock: | 19.30 |
| MA7: | 38.80 | |
| MA20: | 40.73 | |
| MA50: | 43.47 | |
| MA100: | 44.41 | |
| MAexp7: | 38.81 | |
| MAexp20: | 40.39 | |
| MAexp50: | 42.61 | |
| MAexp100: | 43.96 | |
| Price / MA7: | -1.68% | |
| Price / MA20: | -6.33% | |
| Price / MA50: | -12.24% | |
| Price / MA100: | -14.10% | |
| Price / MAexp7: | -1.70% | |
| Price / MAexp20: | -5.55% | |
| Price / MAexp50: | -10.47% | |
| Price / MAexp100: | -13.22% |
News
The last news published on FREEPORT-MCMORAN INC. at the time of the generation of this analysis was as follows:
- 12/18/2024 - 13:30 Freeport Declares Quarterly Cash Dividends on Common Stock
- 08/11/2023 - 15:38 Freeport-McMoRan Investigating Cybersecurity Incident
- 07/20/2023 - 12:00 Freeport-McMoRan Second-Quarter 2023 Financial and Operating Results Release Available on Its Website
- 06/21/2023 - 12:30 Freeport-McMoRan Declares Quarterly Cash Dividends on Common Stock
- 04/21/2023 - 12:00 Freeport-McMoRan First-Quarter 2023 Financial and Operating Results Release Available on Its Website
About author
Online


Add a comment
Comments
0 comments on the analysis FREEPORT-MCMORAN INC. - Daily