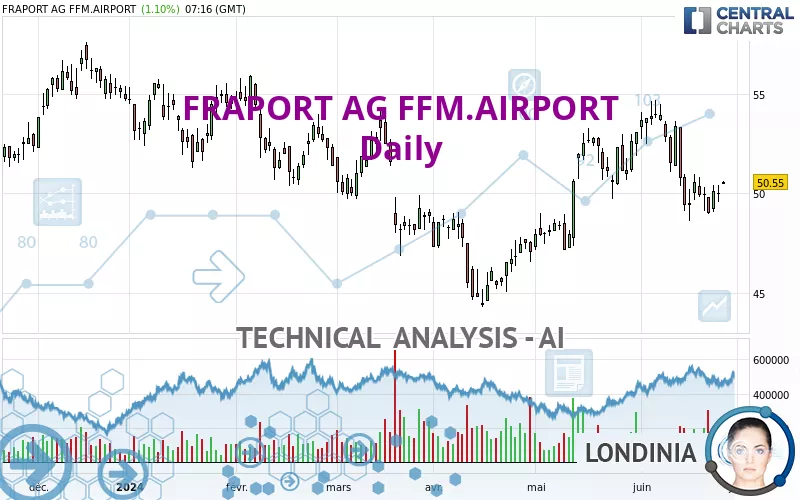
FRAPORT AG FFM.AIRPORT - Daily - Technical analysis published on 06/26/2024 (GMT)
- 146
- 0
Click here for a new analysis!
- Timeframe : Daily
- - Analysis generated on
- Status : TARGET REACHED
Summary of the analysis

Additional analysis
Quotes
FRAPORT AG FFM.AIRPORT rating 50.55 EUR. The price has increased by +1.10% since the last closing and was traded between 50.45 EUR and 50.60 EUR over the period. The price is currently at +0.20% from its lowest and -0.10% from its highest.The Central Gaps scanner detects a bullish gap which is a sign that buyers have taken the lead in the very short term.
Opening Gap UP
Type : Bullish
Timeframe : Openning
A study of price movements over other periods shows the following variations:
Near a new LOW record (1 month)
Type : Bearish
Timeframe : Weekly
Technical
A technical analysis in Daily of this FRAPORT AG FFM.AIRPORT chart shows a slightly bearish trend. Only 53.57% of the signals given by moving averages are bearish. This slightly bearish trend is not supported by the signals currently being given by short-term moving averages. The Central Indicators market scanner is currently detecting several bullish signals that could impact this trend:
Bullish price crossover with Moving Average 100
Type : Bullish
Timeframe : Daily
Bullish price crossover with adaptative moving average 50
Type : Bullish
Timeframe : Daily
The technical indicators are generally neutral. They do not provide relevant information on the direction of future price movements.
Central Indicators, the scanner specialised in technical indicators, has identified these signals:
Pivot points : price is over resistance 1
Type : Neutral
Timeframe : Daily
Price is back over the pivot point
Type : Bullish
Timeframe : Weekly
An analysis of the price chart with the Central Patterns scanner (detector of chart patterns and resistances and supports) shows a result that can have an impact on the price change:
Near support of triangle
Type : Bullish
Timeframe : Daily
Central Candlesticks, the scanner specialised in Japanese candlesticks, detects these signals that could have an impact on the current short-term trend:
Upside gap
Type : Bullish
Timeframe : Daily
Bearish doji star
Type : Bearish
Timeframe : Daily
| S3 | S2 | S1 | Price | R1 | R2 | R3 | |
|---|---|---|---|---|---|---|---|
| ProTrendLines | 47.99 | 49.42 | 50.49 | 50.55 | 51.81 | 54.86 | 56.80 |
| Change (%) | -5.06% | -2.24% | -0.12% | - | +2.49% | +8.53% | +12.36% |
| Change | -2.56 | -1.13 | -0.06 | - | +1.26 | +4.31 | +6.25 |
| Level | Intermediate | Intermediate | Minor | - | Major | Major | Intermediate |
To determine price objectives, it is also possible to use the pivot points. Here is the price position in relation to pivot points:
| Pivot points | S3 | S2 | S1 | PP | R1 | R2 | R3 |
|---|---|---|---|---|---|---|---|
| Standard | 48.73 | 49.15 | 49.57 | 49.99 | 50.41 | 50.83 | 51.25 |
| Camarilla | 49.77 | 49.85 | 49.92 | 50.00 | 50.08 | 50.15 | 50.23 |
| Woodie | 48.74 | 49.15 | 49.58 | 49.99 | 50.42 | 50.83 | 51.26 |
| Fibonacci | 49.15 | 49.47 | 49.67 | 49.99 | 50.31 | 50.51 | 50.83 |
| Pivot points | S3 | S2 | S1 | PP | R1 | R2 | R3 |
|---|---|---|---|---|---|---|---|
| Standard | 45.69 | 47.15 | 48.09 | 49.55 | 50.49 | 51.95 | 52.89 |
| Camarilla | 48.38 | 48.60 | 48.82 | 49.04 | 49.26 | 49.48 | 49.70 |
| Woodie | 45.44 | 47.02 | 47.84 | 49.42 | 50.24 | 51.82 | 52.64 |
| Fibonacci | 47.15 | 48.06 | 48.63 | 49.55 | 50.46 | 51.03 | 51.95 |
| Pivot points | S3 | S2 | S1 | PP | R1 | R2 | R3 |
|---|---|---|---|---|---|---|---|
| Standard | 42.90 | 45.02 | 49.06 | 51.18 | 55.22 | 57.34 | 61.38 |
| Camarilla | 51.41 | 51.97 | 52.54 | 53.10 | 53.67 | 54.23 | 54.79 |
| Woodie | 43.86 | 45.50 | 50.02 | 51.66 | 56.18 | 57.82 | 62.34 |
| Fibonacci | 45.02 | 47.37 | 48.83 | 51.18 | 53.53 | 54.99 | 57.34 |
Numerical data
The following are the details of the technical indicators and moving averages that were collected to generate this technical analysis:
| RSI (14): | 48.45 | |
| MACD (12,26,9): | -0.2900 | |
| Directional Movement: | -3.80 | |
| AROON (14): | -50.00 | |
| DEMA (21): | 50.63 | |
| Parabolic SAR (0,02-0,02-0,2): | 51.65 | |
| Elder Ray (13): | -0.10 | |
| Super Trend (3,10): | 53.75 | |
| Zig ZAG (10): | 50.60 | |
| VORTEX (21): | 0.9300 | |
| Stochastique (14,3,5): | 27.15 | |
| TEMA (21): | 49.91 | |
| Williams %R (14): | -66.10 | |
| Chande Momentum Oscillator (20): | -2.25 | |
| Repulse (5,40,3): | 0.6000 | |
| ROCnROLL: | 1 | |
| TRIX (15,9): | 0.0200 | |
| Courbe Coppock: | 11.88 |
| MA7: | 50.02 | |
| MA20: | 51.62 | |
| MA50: | 50.03 | |
| MA100: | 50.24 | |
| MAexp7: | 50.22 | |
| MAexp20: | 50.79 | |
| MAexp50: | 50.58 | |
| MAexp100: | 50.55 | |
| Price / MA7: | +1.06% | |
| Price / MA20: | -2.07% | |
| Price / MA50: | +1.04% | |
| Price / MA100: | +0.62% | |
| Price / MAexp7: | +0.66% | |
| Price / MAexp20: | -0.47% | |
| Price / MAexp50: | -0.06% | |
| Price / MAexp100: | -0% |
News
Don't forget to follow the news on FRAPORT AG FFM.AIRPORT. At the time of publication of this analysis, the latest news was as follows:
- EQS-News: Fraport AG Frankfurt Airport Services Worldwide: Share Buyback for the Employee Participation Program
- EQS-News: Fraport AG Frankfurt Airport Services Worldwide: Share Buyback for the Employee Participation Program
- Fraport Group Interim Report - First Half 2022: Revenue Boosted by Rising Passenger Traffic
- DGAP-News: Fraport AG Frankfurt Airport Services Worldwide: Share Buyback for the Employee Participation Program
- Fraport Group Interim Release - First Quarter 2022: Key Operating Figures Improve Noticeably
About author
Online


Add a comment
Comments
0 comments on the analysis FRAPORT AG FFM.AIRPORT - Daily