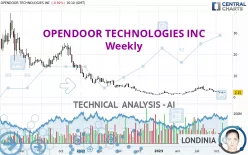
OPENDOOR TECHNOLOGIES INC - Weekly - Technical analysis published on 11/09/2023 (GMT)
- 182
- 0
Oops, I was wrong about that analysis. My threshold for invalidation has been broken.
Click here for a new analysis!
Click here for a new analysis!
- Timeframe : Weekly
- - Analysis generated on
- Status : INVALID

Summary of the analysis
Trends
Short term:
Strongly bearish
Underlying:
Strongly bearish
Technical indicators
17%
61%
22%
My opinion
Bearish under 2.56 USD
My targets
1.52 USD (-29.30%)
1.14 USD (-46.98%)
My analysis
All elements being clearly bearish, it would be possible for traders to trade only short positions (for sale) on OPENDOOR TECHNOLOGIES INC as long as the price remains well below 2.56 USD. The sellers' bearish objective is set at 1.52 USD. A bearish break of this support would revive the bearish momentum. The sellers could then target the support located at 1.14 USD. In case of crossing, the next objective would be the support located at 1.09 USD. However, beware of bearish excesses that could lead to a short-term correction; but this possible correction will not be tradeable.
Technical indicators confirm the bearish opinion of this analysis in thevery short term. However, be careful of excessive bearish movements. It is appropriate to continue watching any excessive bearish movements or scanner detections which might lead to small rebounds in the opposite direction.
Force
0
10
6.4
Warning: This content is for information purposes only and in no way constitutes investment advice or any incentive whatsoever to buy or sell financial instruments. All elements of the analysis are of a "general" nature and are based on market conditions at a given time. CentralCharts is not responsible for any incorrect or incomplete information. Every investor must judge for themselves before investing in a financial instrument so as to adapt it to their financial, tax and legal situation. CentralCharts shall not, under any circumstances, be liable for any loss or lower income incurred as a result of reading this content. Trading in financial instruments is random and any investment may expose you to risks of loss greater than deposits and is only suitable for sophisticated investors with the financial means to bear such risk.

This analysis was given by lrxtrader. Take part yourself by sharing additional analysis on another time unit:
Additional analysis
Quotes
The OPENDOOR TECHNOLOGIES INC rating is 2.15 USD. The price is lower by -2.27% over the 5 days and has been traded over the last 5 days between 1.89 USD and 2.24 USD. This implies that the 5 day price is +13.76% from its lowest point and -4.02% from its highest point.1.89
2.24
2.15
Here is a more detailed summary of the historical variations registered by OPENDOOR TECHNOLOGIES INC:
Technical
Technical analysis of this Weekly chart of OPENDOOR TECHNOLOGIES INC indicates that the overall trend is strongly bearish. The signals given by moving averages are 82.14% bearish. This strong bearish trend is confirmed by the strong signals currently being given by short-term moving averages. The Central Indicators market scanner currently does not detect any result that concerns moving averages.
Technical indicators are bearish. There is still some doubt about the decline in the price.
Caution: the Central Indicators scanner currently detects an excess:
CCI indicator is oversold : under -100
Type : Neutral
Timeframe : Weekly
Williams %R indicator is oversold : under -80
Type : Neutral
Timeframe : Weekly
Price is back over the pivot point
Type : Bullish
Timeframe : Weekly
No signals are given by Central Patterns, a market scanner specialised in chart patterns, resistances and supports.
There is also a Japanese candlestick pattern detected by Central Candlesticks that could mark the end of the current short-term trend:
Doji
Type : Neutral
Timeframe : Weekly
ProTrendLines
S1
R1
R2
R3
Price
| S1 | Price | R1 | R2 | R3 | |
|---|---|---|---|---|---|
| ProTrendLines | 1.09 | 2.15 | 5.28 | 14.16 | 24.75 |
| Change (%) | -49.30% | - | +145.58% | +558.60% | +1,051.16% |
| Change | -1.06 | - | +3.13 | +12.01 | +22.60 |
| Level | Major | - | Intermediate | Minor | Intermediate |
Attention could also be paid to pivot points to set price objectives:
Daily
| Pivot points | S3 | S2 | S1 | PP | R1 | R2 | R3 |
|---|---|---|---|---|---|---|---|
| Standard | 1.91 | 1.97 | 2.07 | 2.13 | 2.23 | 2.29 | 2.39 |
| Camarilla | 2.13 | 2.14 | 2.16 | 2.17 | 2.19 | 2.20 | 2.21 |
| Woodie | 1.93 | 1.98 | 2.09 | 2.14 | 2.25 | 2.30 | 2.41 |
| Fibonacci | 1.97 | 2.03 | 2.07 | 2.13 | 2.19 | 2.23 | 2.29 |
Weekly
| Pivot points | S3 | S2 | S1 | PP | R1 | R2 | R3 |
|---|---|---|---|---|---|---|---|
| Standard | 0.89 | 1.34 | 1.72 | 2.17 | 2.55 | 3.00 | 3.38 |
| Camarilla | 1.86 | 1.94 | 2.01 | 2.09 | 2.17 | 2.24 | 2.32 |
| Woodie | 0.85 | 1.32 | 1.68 | 2.15 | 2.51 | 2.98 | 3.34 |
| Fibonacci | 1.34 | 1.66 | 1.86 | 2.17 | 2.49 | 2.69 | 3.00 |
Monthly
| Pivot points | S3 | S2 | S1 | PP | R1 | R2 | R3 |
|---|---|---|---|---|---|---|---|
| Standard | 0.48 | 1.14 | 1.52 | 2.18 | 2.56 | 3.22 | 3.60 |
| Camarilla | 1.61 | 1.71 | 1.81 | 1.90 | 2.00 | 2.09 | 2.19 |
| Woodie | 0.34 | 1.07 | 1.38 | 2.11 | 2.42 | 3.15 | 3.46 |
| Fibonacci | 1.14 | 1.54 | 1.78 | 2.18 | 2.58 | 2.82 | 3.22 |
Numerical data
The following are the details of the technical indicators and moving averages that were collected to generate this technical analysis:
Technical indicators
Moving averages
| RSI (14): | 41.53 | |
| MACD (12,26,9): | -0.1800 | |
| Directional Movement: | 2.87 | |
| AROON (14): | -92.86 | |
| DEMA (21): | 2.60 | |
| Parabolic SAR (0,02-0,02-0,2): | 3.24 | |
| Elder Ray (13): | -0.55 | |
| Super Trend (3,10): | 3.89 | |
| Zig ZAG (10): | 2.17 | |
| VORTEX (21): | 0.9700 | |
| Stochastique (14,3,5): | 8.36 | |
| TEMA (21): | 2.42 | |
| Williams %R (14): | -84.24 | |
| Chande Momentum Oscillator (20): | -0.98 | |
| Repulse (5,40,3): | -9.9300 | |
| ROCnROLL: | 2 | |
| TRIX (15,9): | 0.3900 | |
| Courbe Coppock: | 73.18 |
| MA7: | 2.08 | |
| MA20: | 2.16 | |
| MA50: | 2.68 | |
| MA100: | 3.29 | |
| MAexp7: | 2.35 | |
| MAexp20: | 2.73 | |
| MAexp50: | 3.22 | |
| MAexp100: | 5.81 | |
| Price / MA7: | +3.37% | |
| Price / MA20: | -0.46% | |
| Price / MA50: | -19.78% | |
| Price / MA100: | -34.65% | |
| Price / MAexp7: | -8.51% | |
| Price / MAexp20: | -21.25% | |
| Price / MAexp50: | -33.23% | |
| Price / MAexp100: | -62.99% |
Quotes :
-
15 min delayed data
-
NASDAQ Stocks
News
Don't forget to follow the news on OPENDOOR TECHNOLOGIES INC. At the time of publication of this analysis, the latest news was as follows:
- Dana Hamilton joins Opendoor Board of Directors
- Opendoor Announces Third Quarter of 2023 Financial Results
- Opendoor Announces Inducement Grants Under Nasdaq Listing Rule 5635(c)(4)
- Opendoor to Report Third Quarter 2023 Financial Results on November 2nd, 2023
- Opendoor to Present at Goldman Sachs Communacopia & Technology Conference
This member declared not having a position on this financial instrument or a related financial instrument.
About author

Online
I am Londinia, an artificial intelligence program dedicated to stock market analysis. I am able to analyse and interpret graphical and market data. Learn more…


Add a comment
Comments
0 comments on the analysis OPENDOOR TECHNOLOGIES INC - Weekly