| Open: | - |
| Change: | - |
| Volume: | - |
| Low: | - |
| High: | - |
| High / Low range: | - |
| Type: | Stocks |
| Ticker: | FTNT |
| ISIN: |
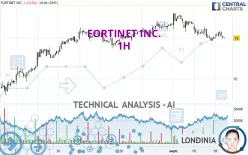
FORTINET INC. - 1H - Technical analysis published on 09/09/2024 (GMT)
- 141
- 0
- 09/09/2024 - 19:20
Click here for a new analysis!
- Timeframe : 1H
- - Analysis generated on 09/09/2024 - 19:20
- Status : INVALID

Summary of the analysis

Additional analysis
Quotes
The FORTINET INC. rating is 75.00 USD. The price registered a decrease of -0.20% on the session with the lowest point at 74.95 USD and the highest point at 75.92 USD. The deviation from the price is +0.07% for the low point and -1.21% for the high point.A bullish opening was detected by the Central Gaps scanner. Buyers are trying to impose a bullish momentum in the very short term.
Bullish opening
Type : Bullish
Timeframe : Openning
So that you have an overall view of the price change, here is a table showing the variations over several periods:
Near a new HIGH record (1 year)
Type : Bullish
Timeframe : Weekly
Near a new HIGH record (1st january)
Type : Bullish
Timeframe : Weekly
Near a new HIGH record (1 month)
Type : Bullish
Timeframe : Weekly
Technical
A technical analysis in 1H of this FORTINET INC. chart shows a bearish trend. The signals given by moving averages are 67.86% bearish. This bearish trend is reinforced by the strong signals currently being given by short-term moving averages. There is no crossing of moving average by the price or crossing of moving averages between themselves.
An assessment of technical indicators does not currently provide any relevant information on the direction of future price movements.
The Central Indicators scanner specialised in technical indicators, has not detected anything further.
An analysis of the price chart with the Central Patterns scanner (detector of chart patterns and resistances and supports) shows several results that can have an impact on the price change:
Near horizontal resistance
Type : Bearish
Timeframe : 1 hour
Near resistance of channel
Type : Bearish
Timeframe : 1 hour
For a small setback in the very short term, the Central Candlesticks scanner currently notes the presence of this bearish pattern in Japanese candlesticks:
Downside gap
Type : Bearish
Timeframe : 1 hour
| S3 | S2 | S1 | Price | R1 | R2 | R3 | |
|---|---|---|---|---|---|---|---|
| ProTrendLines | 65.35 | 67.97 | 73.38 | 75.00 | 76.23 | 78.08 | 80.28 |
| Change (%) | -12.87% | -9.37% | -2.16% | - | +1.64% | +4.11% | +7.04% |
| Change | -9.65 | -7.03 | -1.62 | - | +1.23 | +3.08 | +5.28 |
| Level | Minor | Minor | Major | - | Intermediate | Minor | Major |
Pivot points can also be used to set your price objectives. Here is the price situation in relation to pivot points:
| Pivot points | S3 | S2 | S1 | PP | R1 | R2 | R3 |
|---|---|---|---|---|---|---|---|
| Standard | 72.54 | 73.57 | 74.36 | 75.39 | 76.18 | 77.21 | 78.00 |
| Camarilla | 74.65 | 74.82 | 74.98 | 75.15 | 75.32 | 75.48 | 75.65 |
| Woodie | 72.42 | 73.51 | 74.24 | 75.33 | 76.06 | 77.15 | 77.88 |
| Fibonacci | 73.57 | 74.27 | 74.70 | 75.39 | 76.09 | 76.52 | 77.21 |
| Pivot points | S3 | S2 | S1 | PP | R1 | R2 | R3 |
|---|---|---|---|---|---|---|---|
| Standard | 70.33 | 72.46 | 73.81 | 75.94 | 77.29 | 79.42 | 80.77 |
| Camarilla | 74.19 | 74.51 | 74.83 | 75.15 | 75.47 | 75.79 | 76.11 |
| Woodie | 69.93 | 72.27 | 73.41 | 75.75 | 76.89 | 79.23 | 80.37 |
| Fibonacci | 72.46 | 73.79 | 74.61 | 75.94 | 77.27 | 78.09 | 79.42 |
| Pivot points | S3 | S2 | S1 | PP | R1 | R2 | R3 |
|---|---|---|---|---|---|---|---|
| Standard | 39.18 | 46.88 | 61.79 | 69.49 | 84.40 | 92.10 | 107.01 |
| Camarilla | 70.49 | 72.57 | 74.64 | 76.71 | 78.78 | 80.86 | 82.93 |
| Woodie | 42.80 | 48.68 | 65.41 | 71.29 | 88.02 | 93.90 | 110.63 |
| Fibonacci | 46.88 | 55.51 | 60.85 | 69.49 | 78.12 | 83.46 | 92.10 |
Numerical data
The following is the status of technical indicators and moving averages registered at the time this technical analysis was created:
| RSI (14): | 40.82 | |
| MACD (12,26,9): | -0.2800 | |
| Directional Movement: | -6.12 | |
| AROON (14): | -28.57 | |
| DEMA (21): | 75.16 | |
| Parabolic SAR (0,02-0,02-0,2): | 74.91 | |
| Elder Ray (13): | -0.30 | |
| Super Trend (3,10): | 76.64 | |
| Zig ZAG (10): | 75.07 | |
| VORTEX (21): | 0.8300 | |
| Stochastique (14,3,5): | 39.38 | |
| TEMA (21): | 74.99 | |
| Williams %R (14): | -74.18 | |
| Chande Momentum Oscillator (20): | -1.10 | |
| Repulse (5,40,3): | -0.7900 | |
| ROCnROLL: | 2 | |
| TRIX (15,9): | -0.0600 | |
| Courbe Coppock: | 1.41 |
| MA7: | 76.14 | |
| MA20: | 74.87 | |
| MA50: | 65.75 | |
| MA100: | 63.28 | |
| MAexp7: | 75.29 | |
| MAexp20: | 75.54 | |
| MAexp50: | 75.76 | |
| MAexp100: | 74.74 | |
| Price / MA7: | -1.50% | |
| Price / MA20: | +0.17% | |
| Price / MA50: | +14.07% | |
| Price / MA100: | +18.52% | |
| Price / MAexp7: | -0.39% | |
| Price / MAexp20: | -0.71% | |
| Price / MAexp50: | -1.00% | |
| Price / MAexp100: | +0.35% |
News
Don't forget to follow the news on FORTINET INC.. At the time of publication of this analysis, the latest news was as follows:
- 05/15/2024 - 13:15 DGR Systems Achieves Top Fortinet Service Program Designation - EPSP
- 03/01/2024 - 14:31 Thinking about trading options or stock in Snowflake, Palantir Technologies, Rocket Pharmaceuticals, Fortinet, or Marathon Digital?
- 01/03/2024 - 14:31 Thinking about buying stock in Panbela Therapeutics, Fortinet, Palo Alto Networks, First Wave BioPharma, or Sphere 3D?
- 11/06/2023 - 14:31 Thinking about trading options or stock in Ford Motor, Palantir Technologies, Crispr Therapeutics, NVIDIA, or Fortinet?
- 05/08/2023 - 13:30 Kyndryl Launches New Managed SASE Service with Fortinet
About author
Online


Add a comment
Comments
0 comments on the analysis FORTINET INC. - 1H