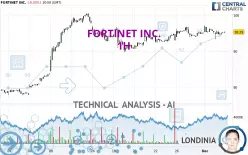
FORTINET INC. - 1H - Technical analysis published on 12/04/2024 (GMT)
- 177
- 0
Click here for a new analysis!
- Timeframe : 1H
- - Analysis generated on
- Status : TARGET REACHED

Summary of the analysis

Additional analysis
Quotes
The FORTINET INC. rating is 95.29 USD. The price registered a decrease of -0.03% on the session and was between 93.38 USD and 95.79 USD. This implies that the price is at +2.05% from its lowest and at -0.52% from its highest.The Central Gaps scanner detects a bearish opening. A small advantage for sellers in the very short term.
Bearish opening
Type : Bearish
Timeframe : Openning
Here is a more detailed summary of the historical variations registered by FORTINET INC.:
Near a new HIGH record (5 years)
Type : Bullish
Timeframe : Weekly
Technical
Technical analysis of FORTINET INC. in 1H shows a strongly overall bullish trend. 82.14% of the signals given by moving averages are bullish. This strongly bullish trend is supported by the strong bullish signals given by short-term moving averages. An assessment of moving averages reveals several bullish signals that could impact this trend:
Bullish trend reversal : adaptative moving average 20
Type : Bullish
Timeframe : 1 hour
Bullish price crossover with Moving Average 20
Type : Bullish
Timeframe : 1 hour
In fact, only 7 technical indicators out of 18 studied are currently positioned bullish. Central Indicators, the detector scanner for these technical indicators recently detected a signal:
Williams %R indicator is back over -50
Type : Bullish
Timeframe : 1 hour
Central Patterns, the market scanner focusing on chart patterns, resistances and supports found this result:
Near support of channel
Type : Bullish
Timeframe : 1 hour
The Central Candlesticks scanner which studies Japanese candlesticks did not detect anything.
| S3 | S2 | S1 | Price | R1 | R2 | |
|---|---|---|---|---|---|---|
| ProTrendLines | 80.28 | 90.79 | 93.87 | 95.29 | 97.18 | 99.15 |
| Change (%) | -15.75% | -4.72% | -1.49% | - | +1.98% | +4.05% |
| Change | -15.01 | -4.50 | -1.42 | - | +1.89 | +3.86 |
| Level | Major | Major | Intermediate | - | Minor | Major |
Attention could also be paid to pivot points to set price objectives:
| Pivot points | S3 | S2 | S1 | PP | R1 | R2 | R3 |
|---|---|---|---|---|---|---|---|
| Standard | 92.19 | 93.56 | 94.44 | 95.81 | 96.69 | 98.06 | 98.94 |
| Camarilla | 94.70 | 94.91 | 95.11 | 95.32 | 95.53 | 95.73 | 95.94 |
| Woodie | 91.95 | 93.44 | 94.20 | 95.69 | 96.45 | 97.94 | 98.70 |
| Fibonacci | 93.56 | 94.42 | 94.95 | 95.81 | 96.67 | 97.20 | 98.06 |
| Pivot points | S3 | S2 | S1 | PP | R1 | R2 | R3 |
|---|---|---|---|---|---|---|---|
| Standard | 88.78 | 90.73 | 92.89 | 94.84 | 97.00 | 98.95 | 101.11 |
| Camarilla | 93.92 | 94.30 | 94.67 | 95.05 | 95.43 | 95.80 | 96.18 |
| Woodie | 88.89 | 90.78 | 93.00 | 94.89 | 97.11 | 99.00 | 101.22 |
| Fibonacci | 90.73 | 92.30 | 93.27 | 94.84 | 96.41 | 97.38 | 98.95 |
| Pivot points | S3 | S2 | S1 | PP | R1 | R2 | R3 |
|---|---|---|---|---|---|---|---|
| Standard | 58.78 | 68.25 | 81.65 | 91.12 | 104.52 | 113.99 | 127.39 |
| Camarilla | 88.76 | 90.86 | 92.95 | 95.05 | 97.15 | 99.24 | 101.34 |
| Woodie | 60.75 | 69.23 | 83.62 | 92.10 | 106.49 | 114.97 | 129.36 |
| Fibonacci | 68.25 | 76.99 | 82.38 | 91.12 | 99.86 | 105.25 | 113.99 |
Numerical data
The following is the status of the technical indicators and moving averages at the time of publication of this technical analysis:
| RSI (14): | 52.29 | |
| MACD (12,26,9): | 0.1200 | |
| Directional Movement: | 0.26 | |
| AROON (14): | -50.00 | |
| DEMA (21): | 95.36 | |
| Parabolic SAR (0,02-0,02-0,2): | 96.75 | |
| Elder Ray (13): | 0.02 | |
| Super Trend (3,10): | 93.77 | |
| Zig ZAG (10): | 95.29 | |
| VORTEX (21): | 1.0200 | |
| Stochastique (14,3,5): | 47.19 | |
| TEMA (21): | 95.18 | |
| Williams %R (14): | -49.74 | |
| Chande Momentum Oscillator (20): | -0.07 | |
| Repulse (5,40,3): | 0.3300 | |
| ROCnROLL: | 1 | |
| TRIX (15,9): | 0.0300 | |
| Courbe Coppock: | 0.10 |
| MA7: | 94.58 | |
| MA20: | 92.43 | |
| MA50: | 84.71 | |
| MA100: | 76.80 | |
| MAexp7: | 95.16 | |
| MAexp20: | 95.14 | |
| MAexp50: | 94.62 | |
| MAexp100: | 93.20 | |
| Price / MA7: | +0.75% | |
| Price / MA20: | +3.09% | |
| Price / MA50: | +12.49% | |
| Price / MA100: | +24.08% | |
| Price / MAexp7: | +0.14% | |
| Price / MAexp20: | +0.16% | |
| Price / MAexp50: | +0.71% | |
| Price / MAexp100: | +2.24% |
News
Don't forget to follow the news on FORTINET INC.. At the time of publication of this analysis, the latest news was as follows:
- DGR Systems Achieves Top Fortinet Service Program Designation - EPSP
- Thinking about trading options or stock in Snowflake, Palantir Technologies, Rocket Pharmaceuticals, Fortinet, or Marathon Digital?
- Thinking about buying stock in Panbela Therapeutics, Fortinet, Palo Alto Networks, First Wave BioPharma, or Sphere 3D?
- Thinking about trading options or stock in Ford Motor, Palantir Technologies, Crispr Therapeutics, NVIDIA, or Fortinet?
- Kyndryl Launches New Managed SASE Service with Fortinet
About author
Online


Add a comment
Comments
0 comments on the analysis FORTINET INC. - 1H