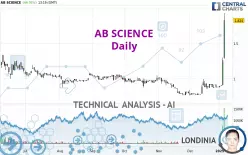
AB SCIENCE - Daily - Technical analysis published on 01/07/2025 (GMT)
- 93
- 0
Click here for a new analysis!
- Timeframe : Daily
- - Analysis generated on
- Status : TARGET REACHED
Summary of the analysis

Additional analysis
Quotes
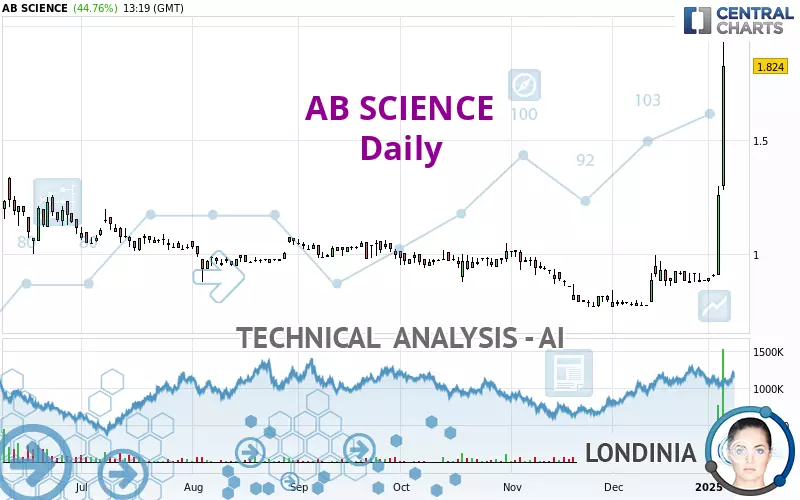
The AB SCIENCE rating is 1.824 EUR. On the day, this instrument gained +44.76% with the lowest point at 1.284 EUR and the highest point at 1.930 EUR. The deviation from the price is +42.06% for the low point and -5.49% for the high point.Here is a more detailed summary of the historical variations registered by AB SCIENCE:
New HIGH record (1st january)
Type : Bullish
Timeframe : Weekly
New HIGH record (1 month)
Type : Bullish
Timeframe : Weekly
Technical
A technical analysis in Daily of this AB SCIENCE chart shows a bullish trend. 78.57% of the signals given by moving averages are bullish. This bullish trend is supported by the strong bullish signals given by short-term moving averages. The Central Indicators market scanner is currently detecting several bullish signals that could impact this trend:
Bullish trend reversal : Moving Average 50
Type : Bullish
Timeframe : Daily
Bullish trend reversal : Moving Average 100
Type : Bullish
Timeframe : Daily
Bullish trend reversal : adaptative moving average 100
Type : Bullish
Timeframe : Daily
Moving Average bullish crossovers : MA20 & MA50
Type : Bullish
Timeframe : Daily
Moving Average bullish crossovers : AMA50 & AMA100
Type : Bullish
Timeframe : Daily
An assessment of technical indicators shows a strong bullish signal.
Central Indicators, the scanner specialised in technical indicators, has identified these signals:
Pivot points : price is over resistance 3
Type : Neutral
Timeframe : Daily
Pivot points : price is over resistance 3
Type : Neutral
Timeframe : Weekly
Central Patterns, the market scanner focusing on chart patterns, resistances and supports found this result:
Resistance of channel is broken
Type : Bullish
Timeframe : Daily
Central Candlesticks, the scanner specialised in Japanese candlesticks, detects a bullish signal that could support the hypothesis of a small rebound in the very short term:
Long white line
Type : Bullish
Timeframe : Daily
| S3 | S2 | S1 | Price | R1 | R2 | R3 | |
|---|---|---|---|---|---|---|---|
| ProTrendLines | 0.774 | 1.054 | 1.230 | 1.824 | 1.887 | 2.115 | 2.280 |
| Change (%) | -57.57% | -42.21% | -32.57% | - | +3.45% | +15.95% | +25.00% |
| Change | -1.050 | -0.770 | -0.594 | - | +0.063 | +0.291 | +0.456 |
| Level | Intermediate | Major | Minor | - | Intermediate | Minor | Major |
Pivot points can also be used to set your price objectives. Here is the price situation in relation to pivot points:
| Pivot points | S3 | S2 | S1 | PP | R1 | R2 | R3 |
|---|---|---|---|---|---|---|---|
| Standard | 0.623 | 0.767 | 1.013 | 1.157 | 1.403 | 1.547 | 1.793 |
| Camarilla | 1.153 | 1.189 | 1.224 | 1.260 | 1.296 | 1.332 | 1.367 |
| Woodie | 0.675 | 0.793 | 1.065 | 1.183 | 1.455 | 1.573 | 1.845 |
| Fibonacci | 0.767 | 0.916 | 1.008 | 1.157 | 1.306 | 1.398 | 1.547 |
| Pivot points | S3 | S2 | S1 | PP | R1 | R2 | R3 |
|---|---|---|---|---|---|---|---|
| Standard | 0.843 | 0.860 | 0.884 | 0.901 | 0.925 | 0.942 | 0.966 |
| Camarilla | 0.896 | 0.900 | 0.903 | 0.907 | 0.911 | 0.915 | 0.918 |
| Woodie | 0.846 | 0.862 | 0.887 | 0.903 | 0.928 | 0.944 | 0.969 |
| Fibonacci | 0.860 | 0.876 | 0.886 | 0.901 | 0.917 | 0.927 | 0.942 |
| Pivot points | S3 | S2 | S1 | PP | R1 | R2 | R3 |
|---|---|---|---|---|---|---|---|
| Standard | 0.547 | 0.659 | 0.771 | 0.883 | 0.995 | 1.107 | 1.219 |
| Camarilla | 0.820 | 0.841 | 0.862 | 0.882 | 0.903 | 0.923 | 0.944 |
| Woodie | 0.546 | 0.659 | 0.770 | 0.883 | 0.994 | 1.107 | 1.218 |
| Fibonacci | 0.659 | 0.745 | 0.798 | 0.883 | 0.969 | 1.022 | 1.107 |
Numerical data
The following is the status of technical indicators and moving averages registered at the time this technical analysis was created:
| RSI (14): | 90.39 | |
| MACD (12,26,9): | 0.1080 | |
| Directional Movement: | 69.371 | |
| AROON (14): | 85.714 | |
| DEMA (21): | 1.111 | |
| Parabolic SAR (0,02-0,02-0,2): | 0.891 | |
| Elder Ray (13): | 0.538 | |
| Super Trend (3,10): | 1.209 | |
| Zig ZAG (10): | 1.834 | |
| VORTEX (21): | 1.2370 | |
| Stochastique (14,3,5): | 79.55 | |
| TEMA (21): | 1.222 | |
| Williams %R (14): | -9.00 | |
| Chande Momentum Oscillator (20): | 0.952 | |
| Repulse (5,40,3): | 59.5060 | |
| ROCnROLL: | 1 | |
| TRIX (15,9): | 0.4870 | |
| Courbe Coppock: | 64.09 |
| MA7: | 1.083 | |
| MA20: | 0.942 | |
| MA50: | 0.911 | |
| MA100: | 0.954 | |
| MAexp7: | 1.197 | |
| MAexp20: | 1.004 | |
| MAexp50: | 0.945 | |
| MAexp100: | 1.029 | |
| Price / MA7: | +68.42% | |
| Price / MA20: | +93.63% | |
| Price / MA50: | +100.22% | |
| Price / MA100: | +91.19% | |
| Price / MAexp7: | +52.38% | |
| Price / MAexp20: | +81.67% | |
| Price / MAexp50: | +93.02% | |
| Price / MAexp100: | +77.26% |
News
Don't forget to follow the news on AB SCIENCE. At the time of publication of this analysis, the latest news was as follows:
- AB Science receives notice of allowance for European patent covering masitinib until 2040 in the treatment of sickle cell disease
- AB Science: Revenues for the first half of 2024 and update on AB Science’s activities
- AB Science announces a slight delay in the publication of its 2024 half-year financial report
- AB Science provides an update on the microtubule program AB8939 and in particular the ability of AB8939 to generate response on MECOM rearrangement
- AB Science provides an update on the development of masitinib in progressive forms of multiple sclerosis post ECTRIMS 2024
About author
Online


Add a comment
Comments
0 comments on the analysis AB SCIENCE - Daily