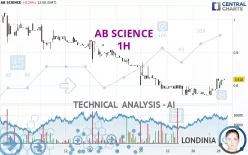
AB SCIENCE - 1H - Technical analysis published on 11/28/2024 (GMT)
- 119
- 0
Click here for a new analysis!
- Timeframe : 1H
- - Analysis generated on
- Status : INVALID

Summary of the analysis

Additional analysis
Quotes
The AB SCIENCE rating is 0.818 EUR. The price is lower by -0.24% since the last closing with the lowest point at 0.791 EUR and the highest point at 0.820 EUR. The deviation from the price is +3.41% for the low point and -0.24% for the high point.A study of price movements over other periods shows the following variations:
New LOW record (5 years)
Type : Bearish
Timeframe : Weekly
Near a new LOW record (1 year)
Type : Bearish
Timeframe : Weekly
Near a new LOW record (1st january)
Type : Bearish
Timeframe : Weekly
Near a new LOW record (1 month)
Type : Bearish
Timeframe : Weekly
Technical
Technical analysis of AB SCIENCE in 1H shows an overall slightly bearish trend. Only 57.14% of the signals given by moving averages are bearish. This slightly bearish trend could quickly be reversed due to the strong bullish signals currently being given by short-term moving averages. The Central Indicators market scanner currently does not detect any result that concerns moving averages.
In fact, according to the parameters integrated into the Central Analyzer system, 14 technical indicators out of 18 analysed are currently bullish. But beware of excesses. The Central Indicators scanner currently detects this:
CCI indicator is overbought : over 100
Type : Neutral
Timeframe : 1 hour
Williams %R indicator is overbought : over -20
Type : Neutral
Timeframe : 1 hour
The Central Patterns scanner, which studies chart patterns, resistances and supports, has identified this signal:
Resistance of channel is broken
Type : Bullish
Timeframe : 1 hour
The Central Candlesticks scanner, specialised in Japanese candlesticks, did not identify any signals.
| S2 | S1 | Price | R1 | R2 | R3 | |
|---|---|---|---|---|---|---|
| ProTrendLines | 0.770 | 0.800 | 0.818 | 0.870 | 0.910 | 0.989 |
| Change (%) | -5.87% | -2.20% | - | +6.36% | +11.25% | +20.90% |
| Change | -0.048 | -0.018 | - | +0.052 | +0.092 | +0.171 |
| Level | Intermediate | Minor | - | Minor | Intermediate | Intermediate |
To determine price objectives, it is also possible to use the pivot points. Here is the price position in relation to pivot points:
| Pivot points | S3 | S2 | S1 | PP | R1 | R2 | R3 |
|---|---|---|---|---|---|---|---|
| Standard | 0.737 | 0.753 | 0.787 | 0.803 | 0.837 | 0.853 | 0.887 |
| Camarilla | 0.806 | 0.811 | 0.815 | 0.820 | 0.825 | 0.829 | 0.834 |
| Woodie | 0.745 | 0.758 | 0.795 | 0.808 | 0.845 | 0.858 | 0.895 |
| Fibonacci | 0.753 | 0.772 | 0.784 | 0.803 | 0.822 | 0.834 | 0.853 |
| Pivot points | S3 | S2 | S1 | PP | R1 | R2 | R3 |
|---|---|---|---|---|---|---|---|
| Standard | 0.663 | 0.727 | 0.763 | 0.827 | 0.863 | 0.927 | 0.963 |
| Camarilla | 0.773 | 0.782 | 0.791 | 0.800 | 0.809 | 0.818 | 0.828 |
| Woodie | 0.650 | 0.720 | 0.750 | 0.820 | 0.850 | 0.920 | 0.950 |
| Fibonacci | 0.727 | 0.765 | 0.789 | 0.827 | 0.865 | 0.889 | 0.927 |
| Pivot points | S3 | S2 | S1 | PP | R1 | R2 | R3 |
|---|---|---|---|---|---|---|---|
| Standard | 0.743 | 0.811 | 0.913 | 0.981 | 1.083 | 1.151 | 1.253 |
| Camarilla | 0.967 | 0.983 | 0.998 | 1.014 | 1.030 | 1.045 | 1.061 |
| Woodie | 0.759 | 0.820 | 0.929 | 0.990 | 1.099 | 1.160 | 1.269 |
| Fibonacci | 0.811 | 0.876 | 0.916 | 0.981 | 1.046 | 1.086 | 1.151 |
Numerical data
The following is the status of the technical indicators and moving averages at the time of publication of this technical analysis:
| RSI (14): | 62.15 | |
| MACD (12,26,9): | 0.0060 | |
| Directional Movement: | 17.404 | |
| AROON (14): | 42.857 | |
| DEMA (21): | 0.802 | |
| Parabolic SAR (0,02-0,02-0,2): | 0.780 | |
| Elder Ray (13): | 0.016 | |
| Super Trend (3,10): | 0.786 | |
| Zig ZAG (10): | 0.817 | |
| VORTEX (21): | 1.2300 | |
| Stochastique (14,3,5): | 92.67 | |
| TEMA (21): | 0.815 | |
| Williams %R (14): | -6.00 | |
| Chande Momentum Oscillator (20): | 0.046 | |
| Repulse (5,40,3): | 1.8880 | |
| ROCnROLL: | 1 | |
| TRIX (15,9): | 0.0230 | |
| Courbe Coppock: | 8.77 |
| MA7: | 0.802 | |
| MA20: | 0.892 | |
| MA50: | 0.947 | |
| MA100: | 0.981 | |
| MAexp7: | 0.809 | |
| MAexp20: | 0.797 | |
| MAexp50: | 0.804 | |
| MAexp100: | 0.835 | |
| Price / MA7: | +2.00% | |
| Price / MA20: | -8.30% | |
| Price / MA50: | -13.62% | |
| Price / MA100: | -16.62% | |
| Price / MAexp7: | +1.11% | |
| Price / MAexp20: | +2.63% | |
| Price / MAexp50: | +1.74% | |
| Price / MAexp100: | -2.04% |
News
The last news published on AB SCIENCE at the time of the generation of this analysis was as follows:
- AB Science receives notice of allowance for European patent covering masitinib until 2040 in the treatment of sickle cell disease
- AB Science: Revenues for the first half of 2024 and update on AB Science’s activities
- AB Science announces a slight delay in the publication of its 2024 half-year financial report
- AB Science provides an update on the microtubule program AB8939 and in particular the ability of AB8939 to generate response on MECOM rearrangement
- AB Science provides an update on the development of masitinib in progressive forms of multiple sclerosis post ECTRIMS 2024
About author
Online


Add a comment
Comments
0 comments on the analysis AB SCIENCE - 1H